A new trick up your sleeve for manual mobile app testers and developers


Whether we’re using mobile apps to send money to a friend, edit a photo, send a message… It’s important that they be easy to use, don’t take ages to load, or take up too much of our cell phone’s battery power and resources. It’s also important that they don’t get in the way of us doing other things as we multitask on our phone.
This is why mobile app performance is so crucial for an app’s success. How well it behaves and actually functions on users’ phones determines how often they will use it. People will most likely even delete an app if it just can’t be used effortlessly enough.
Apptim is a new tool that allows testers, devs, product owners, beta testers, etc. to measure the performance of mobile apps on real devices.
It automatically measures the performance of the app and the device in the background, while you run tests in the app under evaluation. Even better, it enables you to record notes, bugs, ideas, risks and any to-do’s as they occur to you during your testing session.
In this post, I’ll share my own experience with Apptim from a tester’s perspective, working to improve the quality of mobile apps for different client projects.
What is Apptim?
Apptim allows developers and testers to measure and analyze the performance of native mobile applications in real devices very easily and thus decrease risk and prevent certain errors and inconveniences from reaching end users.
While carrying out a test session in Apptim, it automatically evaluates the performance of the app under test, measuring rendering times and resource usage among other things and captures errors that it detects along the way; later it generates a report with all the information collected.
Use and Installation
Apptim consists of a desktop application (called Apptim Desktop) that can be used on Windows to test native Android apps and on MacOS to test native iOS and Android apps.


Apptim has a free version with unlimited tests for personal use and two paid plans: premium and enterprise, with added capabilities like a shared workspace for collaborative work between several team members and performance comparison of test sessions.
In just a few minutes you can get it set up and start using the tool, creating an account on the website and downloading the corresponding version for your operating system. After installing it on your PC, you must sign in with your previously created account. Once you sign in, Apptim will automatically detect the dependencies it needs on your machine and ask you for authorization to download and install them.
Key Features
- Easy to use: Apptim’s user interface is elegant and intuitive, making it a simple tool to use. In addition, on its website you can find detailed documentation that will help you through your first steps with the tool.
- Easy to set up: You will have to make some simple configurations that the Apptim team explains in detail in their documentation here for Android devices, and here for iOS devices. The effort required to start using it is minimal because installing it, starting a test, and getting the results are very simple processes.
- Native app testing: As mentioned above, Apptim evaluates the performance of native mobile apps or hybrid apps (but it only captures data from the native part). Although it can be used for testing mobile web apps, the metrics captured are not specifically aimed at that
- Performance and bug reports: After each test session, the tool generates a report regarding the performance metrics and another report for each bug that you may find during your test session with Apptim.
- Jira integration: Through an API key, it integrates with Jira, so you can publish and track bugs directly in this project management tool (this feature is included in the 14-day free trial period and then it’s only available within paid plans).
- Test on real devices: In order for this tool to do its own thing, you must connect your mobile device with a USB cable to the PC where Apptim is installed.
Performance Testing
In a conversation with Sofía Palamarchuk, Apptim’s co-founder and CEO, she commented that, unlike other existing solutions, Apptim does not require an SDK to be installed to capture performance information; you don’t need to change anything in the application that you want to test. This is why any user (testers, devs, product owners, beta testers, etc.) can use Apptim and access the app’s performance data.
Just by having the app installed on a device, you can start testing and measuring its performance.
The tool measures and evaluates the performance of the device automatically, which eliminates the need for the user to have a deep understanding of the matter. Once the test session is finished, a report is generated on the state of the app, for which the Apptim team has put together this guide to break down all of the metrics and components of the report so you can understand what they mean and what to do with them.
During your manual test, Apptim measures the behavior of the device corresponding to the consumption of the CPU, RAM, network, and battery, while the application runs.
Later, in the report, red and yellow indicators are shown of the instances of consumption that are above Apptim’s predefined thresholds which are based on those recommended by Google and Apple regarding performance.
For every exception that Apptim catches during the test session, it takes a screenshot of the device at that very moment, to later associate it to the issue in the report.
Test Sessions
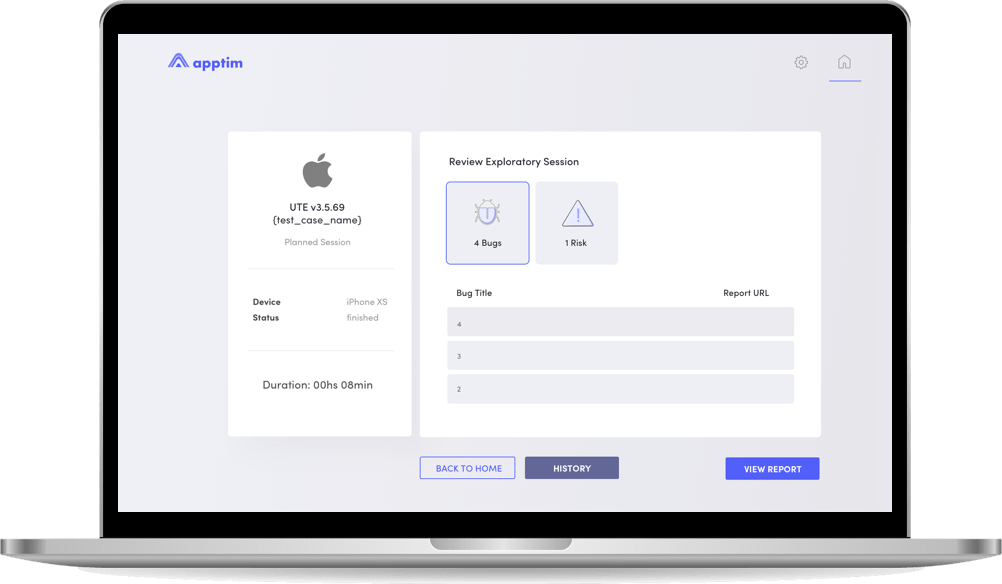
Apptim provides a way to register the tests execution letting you record notes, bugs detected, risks found, ideas and any to-dos that may arise.
For each bug you report, you can include a screenshot (and even edit it) as well as a video related to the incident as evidence, which Apptim captures automatically. All you have to do is indicate if you want to include said image and/or video in the bug report.
After having run several test sessions, Apptim allows you to compare the sessions to analyze performance trends over time and understand how certain changes impact performance. This functionality is super useful when you want to visualize differences in app versions and draw some conclusions that will then allow you to take action to mitigate certain risks. (This feature is also a paid one, but is included in the free trial).
Reports
As our COO, Federico Toledo, put it, “Any optimization that is not around the bottleneck is an illusion of improvement.” Apptim’s reports allow you to easily visualize and understand where any bottlenecks exist in order to improve and optimize app performance in the most appropriate way.
As I stated earlier, it provides a detailed report regarding the app’s consumption of the different resources on the mobile device.
In addition, it includes graphs that show the evolution of the use of the aforementioned resources by the application during the time the test session lasted:
It also includes a video of the session performed, screenshots and logs associated with each crash (even if you yourself did not experience one), which allow us to see what happened in the app at the moment when Apptim caught an error or exception.
The report can be viewed locally on your PC where you ran the test, but can also be published to your Apptim workspace (the cloud part of the tool) to share it with other team members or interested parties, by inviting them to the workspace or through a link.
Private reports can only be accessed by users sharing the same workspace, while public reports can be accessed by anyone with the link (without having their own account). To use this privacy feature in reports, a paid plan is required.
Apptim Reports Include:
- A screen recording of the device during the execution of the exploratory session
- Alerts and warnings related to the user experience
- Alerts and warnings related to the usage of device resources, with reference thresholds, shown in yellow or red depending on their severity
- Test environment data (device, app, version info, etc)
- Crashes/exceptions details with associated screenshots, and the exact minute of the session in which it happened in order to locate the specific moment in the video
- Detail of resource usage with associated graphs
- Logs and downloadable artifacts collected during the test
On the other hand, the tool generates separate reports for each bug registered by the user during the exploratory session. These bugs can be shared independently, since each one has its own link.
As mentioned above, Apptim allows you to push bugs to Jira with a simple click.
Here is what a bug report looks like in Apptim.
What We’d Like to See Next in Apptim
As Apptim is only in beta today, its team is surely working on a nice product roadmap to make the tool as robust and useful as possible.
Some things I hope to see from Apptim in the future include:
- Help us understand the end-to-end of all the layers behind a user action in order to improve the overall performance
- More explanations and clues or tooltips to help understand the results in the performance report to how to fix issues and warnings, as Google Page Speed does with web pages (They told me they are working on this.)
- Real-time metrics and alerts, see how the actions during an exploration are using the mobile resources in order to guide my tests according to what is discovered in the moment
- Improve how the graphs are shown in the report regarding the colors, views (This is also underway by the Apptim team.)
- Allow for test sessions to last more than half an hour
- Allow adding Notes/Risks/Ideas/To-Dos once the test session is over
- Allow exporting Notes/Risks/Ideas/To-Dos to a PDF file or share them in a web-report
Overall Thoughts
From the point of view of a software tester, I can say that Apptim brings enormous added value to the testing process of Android and iOS apps, without requiring too much effort from a tester or developer.
In every report, it provides a lot of useful information that serves as an input to detect, mitigate and prevent risks and bugs.
It is a simple tool to incorporate, intuitive, easy to use and does not require extensive knowledge related to performance.
On that note, I recommend you give Apptim a try and let me know your opinion of the tool as well!
Recommended for You
Quality Sense Podcast: Sofia Palamarchuk – Mobile App Performance
Software Testing Tools We’re Watching in 2020


Abstracta Team
Related Posts
Playwright vs Selenium: Key Insights to Pick the Right Tool
Playwright vs Selenium compared on speed, language coverage, MCP, and scalability—insights to guide enterprise testing decisions with real-world expertise.
7 Security Testing Tools to Try Now
It’s never too soon to assess the security of your application with these great penetration testing tools Remember the Equifax breach in 2017 which affected nearly one in three Americans? Or the 2018 Marriott breach that compromised 500 million accounts in its database? It’s very…
Search
Contents
Categories
- Acceptance testing
- Accessibility Testing
- AI
- API Testing
- Development
- DevOps
- Fintech
- Functional Software Testing
- Healthtech
- Mobile Testing
- Observability Testing
- Partners
- Performance Testing
- Press
- Quallity Engineering
- Security Testing
- Software Quality
- Software Testing
- Test Automation
- Testing Strategy
- Testing Tools
- Work Culture


