From the Cloud to CDNs, performance testing just isn’t what it used to be.
If you are a performance engineer, you may have noticed that today’s new technologies and the challenges that come with them are disrupting the way in which we used to do performance testing. Why do we call them new technological challenges for performance engineers? In the last few years, we have been through huge changes, ones that have required us to use other tools and methodologies that are better adapted to the needs of our clients. In this post, we will share how our performance team has confronted these challenges.
Clearly, our shift in methodology didn’t happen by itself, but from what we learned working side-by-side with businesses both local and in Silicon Valley like BlazeMeter, Shutterfly, Mulesoft, and Heartflow, and by collaborating with our community of performance testers, such as the JMeter community, an open-source tool for performance testing that is the most well-known and used by performance testers.
We will look at four new technological developments individually, the challenges they present, and how to tackle them.
Cloud Performance Testing
If you are not familiar with the concept of Cloud computing, you might imagine it as a cloud of servers and machines. That’s why we love this image:


Cloud is essentially a set of computers/servers run by someone else. One of its great advantages is that these servers can be distributed in any part of the world. It also takes away the limitation of needing physical infrastructure to house our systems, or to have to house our systems far (geographically) from users.
Apart from housing and geographical distribution, the other great advantage of working with technologies in the Cloud is that we pay for what we use and nothing more. Thus the Cloud can be an alternative that is not only easy to use/administrate but also economical.
Cloud Performance Testing Challenges
Having said this, how can the Cloud affect the way in which we do performance testing? The answer is: in monitoring. The way in which we used to monitor, going to clients, installing agents in the physical servers, and collecting indicators is changing. This has given rise to the need for new technologies more adapted to these schemes of monitoring, such as Cloudwatch and New Relic, among others. But what has changed is not only in terms of hosting systems and monitoring.
Today there is a wide variety of sites, such as those for e-commerce, that have thousands of daily visitors and users from all around the world. Somehow, we as performance testers need to be able to offer tests that simulate this high level of user demand.
In the past, we used load generators like JMeter, but the problem was that in order to simulate thousands of users we had to employ two, three, or more load generators, and to configure what we know as a farm, or cluster, of test servers. For this reason, the Cloud concept can also help, giving space for tools in the cloud such as BlazeMeter, solving this limitation. We only have to indicate the script, the test scenario, and from what part of the world that we want to generate the load, and the software will determine and configure how many virtual machines it needs to run the test.
Currently, we have a partnership with BlazeMeter (CA Technologies), working together to improve the options that we have available today to most accurately simulate the actions of users.
I’d like to share a project experience in which the cloud approach played an important role. This project was for a healthcare company from the United States that came to us with the need to test the performance of its system. It had all of its infrastructure housed with Amazon, using auto-scaling policies, and wanted to be able to simulate loads from different parts of the world. For this we used BlazeMeter. Thanks to these tests we realized that the auto-scaling configurations were making it so that each time a server reached a peak of 60% CPU use, it would employ another server.
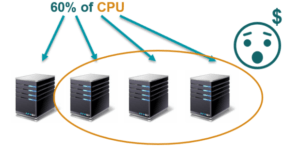

This problem was causing the company to waste resources, as their servers weren’t behaving in an elastic manner. Once the machines were active, they didn’t go down later, remaining on even though they weren’t needed. Once this was observed, the auto-scaling policies were adjusted, and we significantly reduced the number of servers employed, resulting in substantial savings in money expended on infrastructure. Thanks to these performance tests, a simple configuration error was revealed that could have been quite costly, in both money and resources for our client.
CDN (Content Delivery Network)
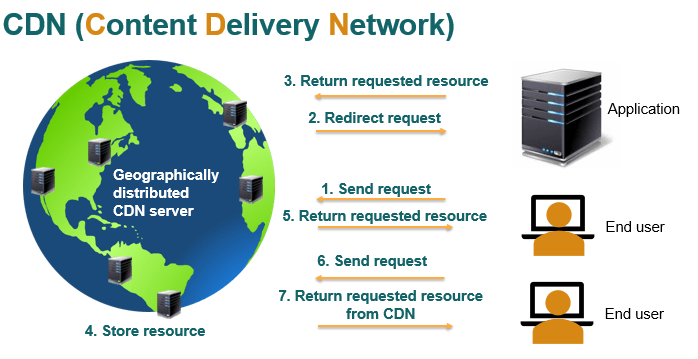
What do we understand about CDN? We can see a CDN like a container for static resources that is geographically distributed, or, put in another way, like a cache distributed around the world. To understand a little better about what is a CDN we can analyze how it functions. Suppose that we have an application housed in the United States and a user wants to access it from the UK, such as shown below:
The process:
- The user requests a resource from the application.
- The CDN receives the request (CDNs have a DNS). Since it’s the first time the request has been made, the CDN solicits this request from the application’s server.
- The application’s server returns the request to the CDN.
- The CDN caches it in a server geographically close to the user’s location.
- Later the CDN returns it to the user.
- The interesting thing about this technology is that if the same or different user geographically close to the original user makes the request again, the CDN doesn’t have to go to the application’s server to retrieve the resource.
- The resource that was just stored in the cache is returned directly to this user.
When we talk about resources and requests, we are referring to static requests like images, JavaScript, CSS, etc. It’s important to note how fast a resource is returned when a request doesn’t have to travel to the application’s server and instead goes directly to a server close to the user.
CDNs also have an advantage in managing security, as one can easily enable HTTPS protocol, which internally allows the use of HTTP/2, which we will discuss later in this post.
CDNS and the Implication for Performance Testing
So, how can the use of a CDN change how we do performance testing? With CDNs we have to be careful in how and where we receive static requests. Clients who use CDNs as part of their testing want to verify that their CDNs are redirecting static content in the correct way, and in this aspect, our knowledge in this area should be valuable to them.
CI/CD (Continuous Integration & Continuous Delivery)
Most of us have more or less heard something about CI/CD. But to what are we referring when we talk about CI/CD? First, it refers to having more deployment instances in the development cycle in the life of a project. It also means that the deployment process is automated, in such a way that we can do it in a more frequent and less risky manner.
What do we gain by deploying more frequently? We are able to detect errors earlier, and more closely to the moment in which they were made. Be it in a line of code, a certain configuration, or change in hardware, we can easily find errors that could be detrimental to the health of our systems.
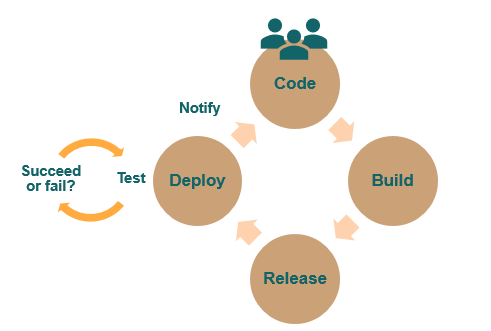
Let’s see what our project’s life cycle is like if we apply CI/CD, starting from when someone in our development team sends code to a repository:
It’s important to emphasize that when a deployment is generated, this automatically triggers a series of tests that verify the success of our build or deploy. These tests can be unit tests, functional tests, a static revision/check of code, and much more.
The interesting thing about this approach is that everything is done automatically, providing us with a notification of whether or not the tests were passed. An example of a tool that supports this type of automatization is Jenkins.
Performance Testing Challenges in CI/CD
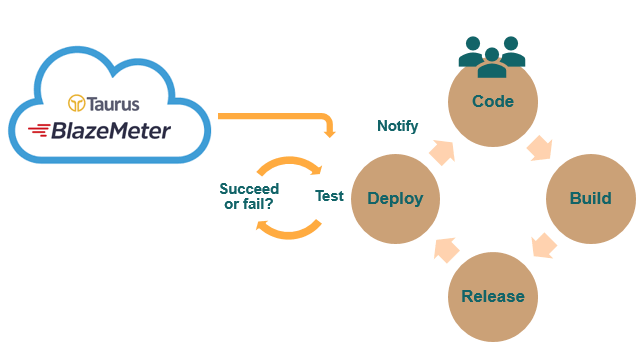
Now, how does this affect our performance tests? At the moment that the cycle of acceptance tests in our deployment is executed, we can add a set of unit performance tests, which will also detect any performance degradation as soon as possible. We have tools appropriate for this task such as Gatling or Taurus.
Our automated tests have performance checks, doing such actions as, for example, measuring response times for a service against a baseline. This way we can have traceability of the improvements, at the performance level, as given through each deployment.
As a real-world example of performance testing in CI/CD, we had the opportunity to work for an e-commerce giant, Shutterfly. The interesting thing about Shutterfly’s situation is that it processes large volumes of information daily, for over 6 million orders from customers each year.
In Shutterfly’s case, its team used Gatling as a load generator and Jenkins as its engine for Continuous Integration. It was truly amazing, novel and encouraging to find that performance testing played an important role in Shutterfly’s development process, helping to improve the final quality of its product.
From this project, we can draw many experiences and takeaways, among them the importance of making a simple and maintainable test design that fits this approach. If you are interested in this experience, check out our blog post about Shutterfly’s continuous performance testing scheme.
HTTP/2
Why a new protocol, HTTP/2?
HTTP/1 was designed in 1996 (20 years ago) and the internet was very different than it is today. Web pages were composed of only text and possibly some images. Today the internet is geared towards offering web applications where we see a lot of multimedia content and constant interaction with the user. A web page could have hundreds of resources and HTTP/1 will only recommend opening two TCP connections at once per domain (browsers don’t follow this recommendation and will open up to six).
Therefore, if we want to load a webpage that has 100 resources (something normal these days) to one domain, we would have to request two resources, wait for the response, receive the response, and only after that could we ask for two more, until we reach the 100 resources needed. Communication in this way is very inefficient.
To improve internet speed, HTTP/1 follows its best practices. But these best practices are indicators that the HTTP/1 protocol is inefficient and that we need a new protocol to meet the demands of current users.
Everyone has heard how a business such as Amazon can lose up to $1,600 million for every second that they delay in delivering content. Also, studies have discovered that 57% of users will abandon a site if it doesn’t load in less than three seconds. It’s obvious that no one enjoys waiting. We want content, and we want it instantaneously. Therefore, HTTP/2 has arrived to improve the performance of our web applications and user experience.
HTTP/2 resulted from a Google experiment in 2009, SPDY. Google developers joined together with the idea of improving the speed and security of the internet. This protocol is binary, and not orientated towards text like HTTP/1, which has led to an improvement in promptness and ease in parsing server responses.
In addition, in this protocol the header is compressed. In HTTP/1, much of the information that is sent in headers is redundant, and in HTTP/2 redundancy is eliminated (information is only sent once). It also uses a compression algorithm for the header.
At the same time, HTTP/2 is implemented over HTTPS. All browsers use TLS over HTTP/2 which improves the security of web applications.
Another important characteristic is multiplexing. As previously said, HTTP/1 recommends two TCP connections per domain. At the moment, browsers break this rule and open up to six TCP connections with the same domain. As we see in the figure, if we want three resources, we have to open three different TCP connections.
Instead, HTTP/2 opens only one TCP connection to ask for three resources, and this is called multiplexing.
That is to say, HTTP/2 permits various requests to be sent in parallel. The response of the server is also parallel, regardless of the order in which the browser receives these responses. Therefore we avoid the waits created by HTTP/1’s sequencing process.
Another big advance in HTTP/2 is Server Push, which allows access to secondary requests in a much simpler way. In HTTP when we make requests to a webpage, first we request the HTML and we receive it. Then the file is parsed and we obtain resources after the requests are sent, between two and six at a time, depending on how the browser works. With HTTP/2 the server is more proactive, and it will respond with the HTML and all the resources that believes are convenient.
Server Push needs to be used with care because we can overload the network by sending many resources that may already be stored in the browser’s cache. It’s not necessary that all the secondary resources are returned, only those that could help the most in improving the page’s load time.
This is why it is said that HTTP/2 accelerates the Internet. But again, what considerations do I have to have as a performance tester when performing my tests?
Performance Testing with HTTP/2
Keeping in mind that we are looking for test automation, in order to capture HTTP/2 traffic the only tools we have today are WireShark or Google Chrome net-internals.
With respect to load generators, how can we simulate HTTP/2 requests? For this we have licensed tools like LoadRunner, which, for the moment, supports HTTP/2, but doesn’t support Server Push.
We don’t yet have free tools that support this new protocol, so we can’t currently faithfully simulate user actions on sites that support HTTP/2.
UPDATE: After publishing this post, an HTTP/2 plugin and HLS plugin for JMeter have since become available thanks to our friends at BlazeMeter!
In Summary
In this post we shared today’s new challenges for performance engineers and how they have reshaped the way in which we go about our performance tests:
- CLOUD: We’ve changed the way we monitor and generate geographically distributed load. We pay for only what we use.
- CDN: We have to analyze where and how static resources come to us.
- CI/CD: We have to adapt our performance test scripts to integrate them into a Continuous Integration environment for immediate results.
- HTTP/2: We need free tools to support the new protocols that users utilize today.
Whether you are responsible for the performance of systems for a large company or small, we want to inspire our community, clients and colleagues to adopt these new approaches that will take your performance engineering to the next level while meeting the demands of today!
For a Spanish version of this blog post, visit Federico Toledo’s blog.
Below is a video of a presentation on this topic in Spanish from TestingUY 2017, given by myself and another Abstracta performance engineer, Leticia Almeida. You can also view our slideshare here.
Now it’s your turn. What technological challenges have you faced as a performance tester? Leave a comment!
Recommended for You
Gatling vs JMeter: Our Findings
Q&A with Melissa Chawla, Senior Manager of Performance Engineering at Shutterfly


Abstracta Team
Related Posts
When is the Best Time to Start Performance Testing?
Should we test performance throughout development or at the end? – Agile vs. Waterfall approaches When taking into account the performance of existing systems or ones built from scratch, teams have to determine at what point in the development process they are going to benefit…
A Quick BlazeMeter University Review
A senior performance tester’s review of the new courses by BlazeMeter Last week, I was looking for fresh knowledge on performance testing, so I asked a teammate of mine if she knew of any courses I could take. She recommended I try BlazeMeter University which…
Search
Contents
Categories
- Acceptance testing
- Accessibility Testing
- AI
- API Testing
- Development
- DevOps
- Fintech
- Functional Software Testing
- Healthtech
- Mobile Testing
- Observability Testing
- Partners
- Performance Testing
- Press
- Quallity Engineering
- Security Testing
- Software Quality
- Software Testing
- Test Automation
- Testing Strategy
- Testing Tools
- Work Culture

