How Shutterfly masters continuous performance testing by “adjusting the belt tight”
Picture this, you are the owner of an e-commerce website and you want to be sure that its excellent customer experience doesn’t deteriorate over time with the introduction of new functionalities and that your customer retention rate remains healthy. For you, one critical pillar for achieving this is having reliable and highly performant web pages. As they say, your competitor is always one click away.
The same goes for Shutterfly, the go-to platform for creating custom photo creations and gifts (that has recently passed the $1 billion mark in revenue), whose performance engineering team is concerned with testing and monitoring its web and application performance on a daily basis. Making sure that each user smoothly sails through the entire process from uploading photos, to designing their creation, to checkout is of the utmost importance for the company to remain the market leader.

Above is a screenshot of a page that lets me preview my custom mug from the Shutterfly website. You can see how its powerful tool allows you to visualize almost any product you can think of with your photo(s) on it! Imagine all the work that goes into making sure this system works perfectly, all the time!
I have been fortunate enough to work with Shutterfly’s performance engineering team, assisting them in the past few months while learning about their cutting-edge continuous performance testing method. I’m thoroughly impressed by how this particular client has devised a way to test so that they can discover degradations in performance almost immediately!
Today I’d like to discuss how Shutterfly’s continuous performance testing methodology works so that you may also use it to your advantage.
The methodology involves a very different approach than that of having a load simulation for acceptance testing, in which we simulate the whole load scenario with a test infrastructure similar to the production environment. We are not substituting that for this, as this is just a way to complement those tests and discover degradations before the acceptance test. This way, we reduce the risk of having to implement big solutions (aka “solve BIG problems”) just a couple of days before the day we wanted to deliver our new version of the system.
Essentially, the goal is to be able to detect the exact moment when someone enters a line of code that impairs the performance of the system. This methodology I will explain provides a great way to do so and to also be able to automatically identify it as soon as possible, having a record that gives us a clue as to when it was inserted so that we can identify it easier.
So, how does it work?
Methodology
First off, a precondition that must be met is to perform tests frequently. Continuous integration would be best, running different sets of tests at different times: basic regression tests before each commit and a full regression at least 2 or 3 times a week. You must have load scenarios (acceptance testing) before putting a new version in production and tests ready for each fix. In Shutterfly’s case, engineers check in code around the clock and the software is updated in the test environment daily.
Secondly, we must make sure that we have an exclusive environment for tests. With an exclusive test environment, the results will be more or less predictable and won’t be affected by if another person, for example, runs something else at the same time, causing the response times to soar, generating false positives, and wasting a whole lot of time.
Another key aspect is that the tests should have acceptance criteria (assertions) as close as possible so that at the slightest system regression, before any negative impact, some validation fails, indicating the problem. This should be done in terms of response times and throughput.
I like to call this “adjusting the belt tight.”
Now I’ll explain how to create, maintain and use this “belt” in performance tests.
Imagine we have a new test up and ready for stress testing the login. What we will do is see just how much we can “tighten the belt”. That is, until what point can we increase the burden on the login while keeping an acceptable service level?
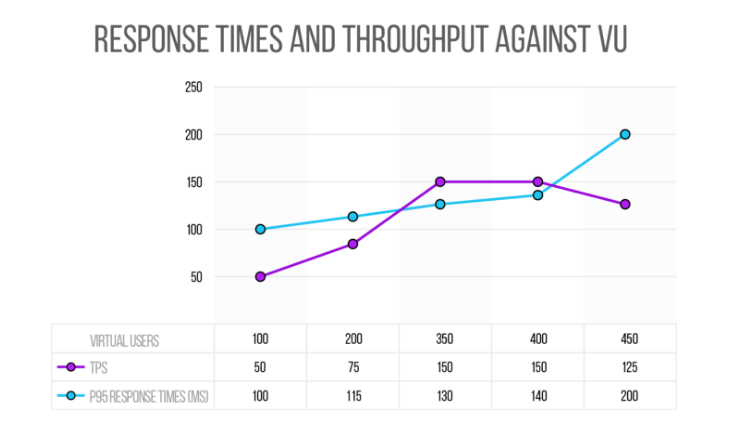
Say we run the first test with 100 concurrent users and as a result, there are no crashes, the response times are below 100ms (at least the 95th percentile) and the throughput is 50 TPS. Then we run the test with 200 virtual users and again, it results in zero crashes and the times are at 115 ms and the throughput is at 75 TPS.
Great, it’s scaling.
If we continue on this path of testing, we will at some point, reach a certain load in which we see that we are no longer achieving an increase in the throughput. We will also be getting errors (exceeding 1%, for example) which would indicate that we are saturating the server and it’s likely that response times from then on will begin to increase significantly, because some process or connection or something begins to stick amid all the architecture of the system.
Following this scenario, imagine we get to 350 concurrent users and we have a throughput of 150 TPS, with 130 millisecond response times and 0% errors. If we pass 400 virtual users and the throughput is still about 150 TPS, with 450 users the throughput will be even less than 150 TPS.
There is a concept called the “knee,” or the point at which performance “degrades ungracefully,” that we would be encountering with this type of testing illustrated in the graphic below. The TPS is expected to increase when we increase the number of concurrent users and if it doesn’t happen, it’s because we are overloading the system’s capacity.
This is the basic methodology for finding the “knee” when doing stress testing, when we want to know how much our servers can scale under the current configuration.
Then, the test that we will schedule to continue running frequently is the one that executes 350 users, is expected to have less than 1% error with expected response times below 130 * 1.2 ms (this way we give ourselves a margin of 20%), and last but not least, we have to assert the throughput, verifying that we are reaching 150 TPS. This is the way we can detect right on time when something degrades the performance.
It is a good idea to monitor the test for a couple of weeks to ensure that this analysis is valid and endures and that the test stabilizes. It is also important to review these values from time to time, just in case the performance of the service improves, in which case, we’d need to adjust the belt even tighter there! Meaning, we’ll always have to adjust the assertion values.
Tools
What tools are needed to accomplish this?
At Shutterfly, we are using Gatling + Jenkins + Graphite + AppDynamics.
I did not mention tools earlier because the same strategy could potentially be implemented with others. The important components are going to be: performance testing tool (for load simulation) + Continuous Integration Engine + Visualize and storage monitoring data + deeper information on the system’s behavior for analyzing problems and providing more information.
Results
The day someone enters a line of code that worsens the response time by 20%, or harms the scalability of the login, it will be detected almost immediately. This is the beauty of continuous performance testing. We can quickly avoid and eliminate any significant degradations of system performance, making sure that the end user never suffers from slowness when a new line of code is introduced.
Another advantage is that it’s not necessary to have the infrastructure similar to that of production. The baseline would be how the system is working today. If we consider it to be good, later we can see what the “knee” is in our test environment and we can work with that, without letting it degrade.
Where cost prohibits the pre-production test environment from having the same scale and performance as production, you can use a scaled down lower performance system and still detect performance regressions. In Shutterfly’s case, one side benefit of using a scaled down version of production is that we can easily generate all of the necessary load from a single machine, which makes reporting the results much simpler. Otherwise, we would need a huge test infrastructure just to reproduce the load simulation!
What do you think of this method? How have you managed to continuously test performance?
A special thanks to Melissa Chawla and Fred Beringer for your support and feedback, helping me to write this post!
Want to learn even more about Shutterfly’s continuous performance testing practices? Watch this webinar recording!
Recommended for You
Yoda’s “The Way of the Jedi Tester”: A Guide for Agile Testing
Gatling tool review for performance tests (written in Scala)