All things equal, how do these two open source load testing tools measure up?
In this post, we share our results from the experiment conducted by Abstracta’s own, Santiago Peraza and Pablo Barceló, in which the objective was to make a comparative benchmark between Gatling and JMeter tools, in versions 2.2.2 and 3.0 respectively.
Aim of the Experiment
We wanted to answer these questions:
1. What is the maximum amount of threads I can run with each of the tools before I start getting errors or saturating some basic resource?
2. Given the same load generated by both tools, is there a significantly different resource use?
Test Configuration
The experiment had only one variable: the tool. The rest we kept the same: infrastructure, test, load scenario, system under test, network, etc.
Infrastructure for the Test
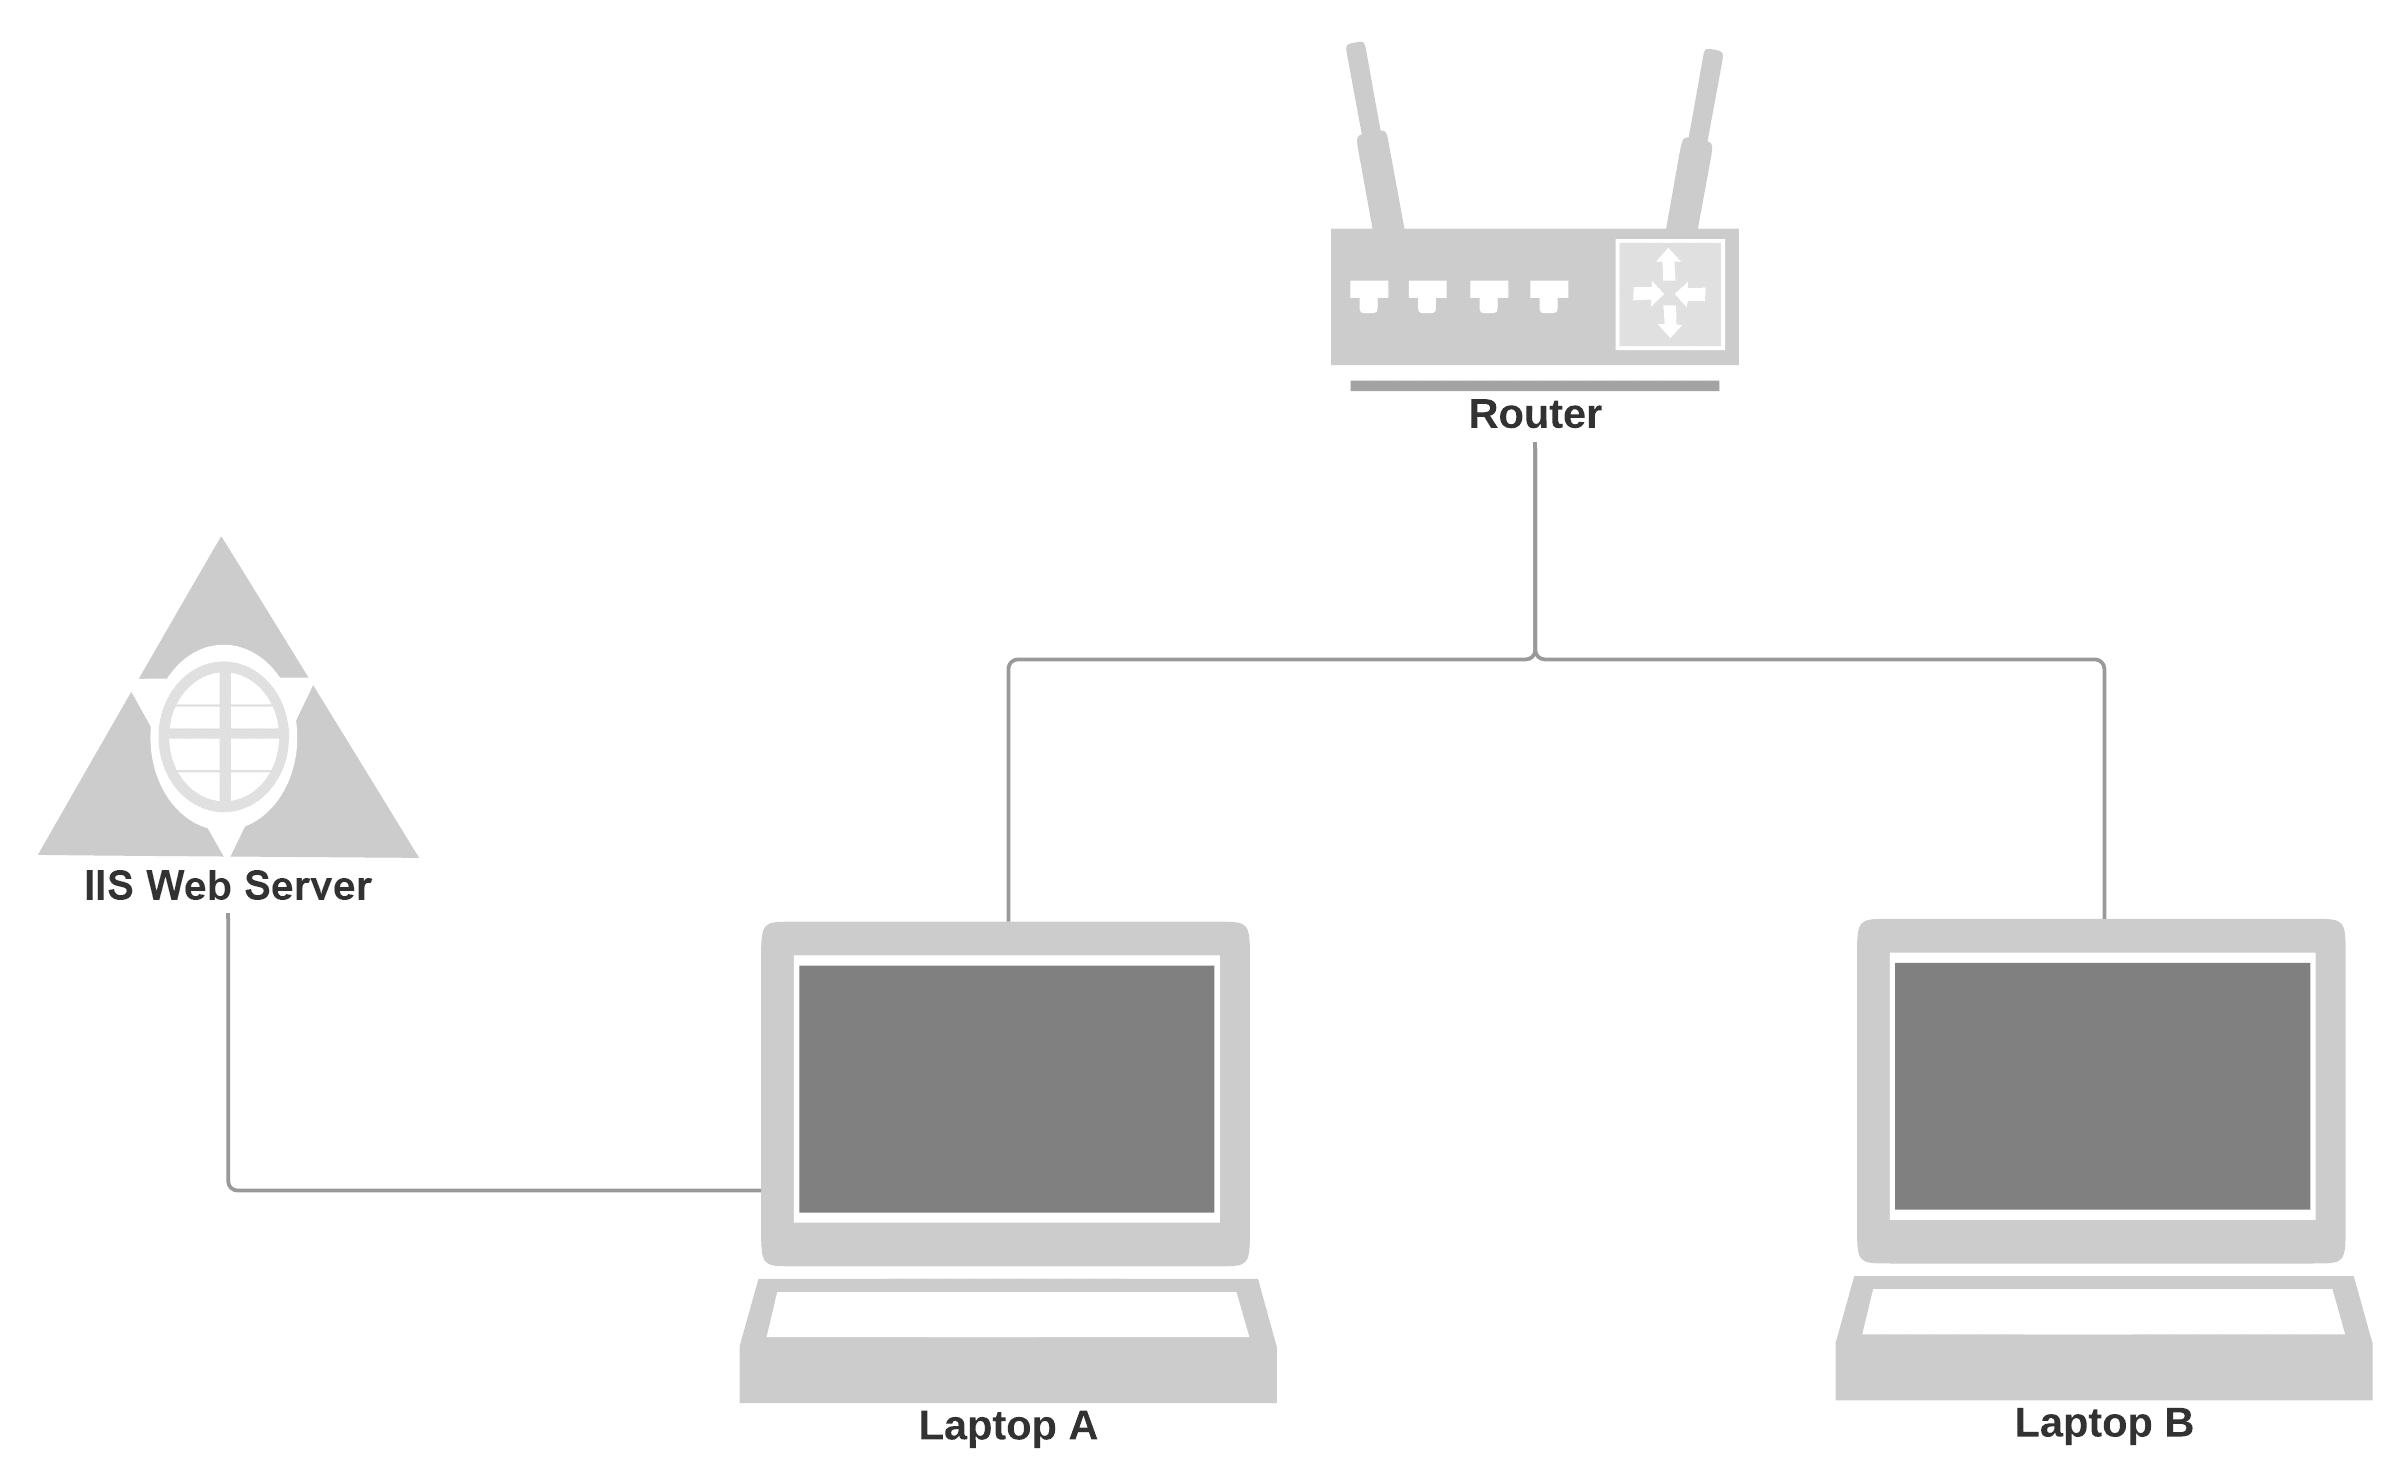
To carry out the test, we decided that the best option was to use two machines, both connected to the same router through two Ethernet connection cables and generate load by making requests from one to the other. For that, we installed in one of the PCs (Laptop A) the Microsoft IIS software, which converts one PC into a web server, and we used the other PC (Laptop B) as a load generator. The laptops had 6GB of RAM and an Intel Core i5-5200U of 2.20GHz with 2 cores and 4 threads per core.
Configuration Considerations
To make the comparison as fair as possible, it was necessary to take into account some factors that may affect performance, such as secondary orders, cookies and cache. Gatling handles cookies and cache by default; but that is not so in the case of JMeter. Therefore, it was necessary to configure the tools in the same way to avoid biased results.
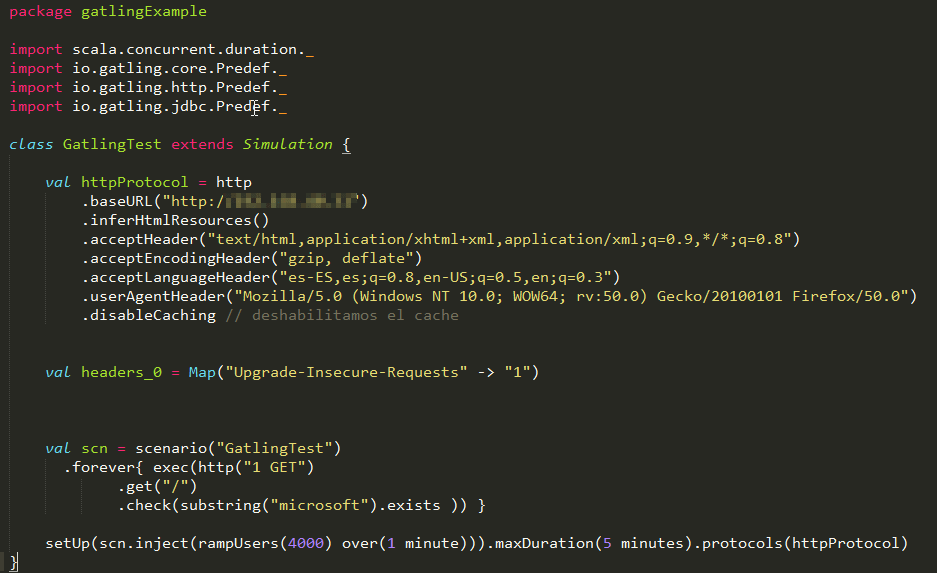
- Cache: At the moment of defining the test you can choose to use the cache management (in that case it is necessary to add an element of the type HTTP Cache Manager in JMeter) or without handling the cache (in this case it is necessary to disable the handling of cache by Gatling, adding the disableCaching line in the HTTP protocol configuration). In our case, we chose to disable the handling of the cache in Gatling in order to generate a greater load during the tests.
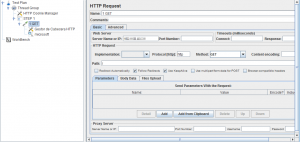
- Secondary requests: Both Gatling and JMeter do not invoke the default secondary requests, so in the Gatling script we included the inferHtmlResources line, and in JMeter we enabled the Retrieve All Embedded Resources option of the HTTP Request.
- Cookies: Keeping in mind that we made the requests on a static website, it was not necessary to take into account the handling of the cookies.
Test Scenario
We prepared the following scenario in both tools:
- Incremental number of virtual concurrent users, using a one-minute ramp-up on all executions.
- Endless and constant iterations for the duration of the test
- Test duration: 5 minutes
Test Scripts in Gatling and JMeter
The scripts were very simple and both did the same thing.
Results
#1 – Different Handling of Connections & Threads
The first result was that JMeter handled connections differently, which made it necessary to make an adjustment at the operating system level in order to reach the same number of concurrent virtual users.
Connections
In a first instance with JMeter simulating 400 users we observed connection errors (Non HTTP response code: java.net.BindException). These errors are caused by limits at the operating system level. In particular we were using Windows, where TCP / IP connections use the ports 1024-5000 output, so if many connections are generated in a short time, these ports become saturated. To avoid this problem, you must increase the number of ports available for connections by following the steps described on this page.
In turn, using Gatling, we managed to run tests with up to 4,000 concurrent virtual users without encountering this problem. In order to find an explanation for why this limitation is present in one tool and not in the other, we did some further investigating, arriving at the hypothesis that the explanation is in how these tools handle connections:
Gatling: According to what I understand of what is explained here, Gatling handles a pool of connections per virtual user, but the important thing is that in the sequential requests, it reuses connections by default.
JMeter: According to what is discussed here, JMeter does not. Additionally, the JMeter documentation mentions: There is no control over how connections are reused. When a connection is released by JMeter, it may or may not be reused by the same thread.
Threads
Related to the above, there is another interesting aspect that differentiates how each tool works with respect to the management of virtual users. In the case of JMeter, we have processes that make synchronous requests, and Gatling handles an asynchronous process through the use of handlers. This OctoPerf article explains the differences quite clearly. Both have the possibility to manage a pool of connections per user, which in the case of having several secondary orders, (something that didn’t happen in our experiment), they are done in parallel as the browsers usually do. In Gatling this is the default configuration, with a maximum of 6 simultaneous connections, in JMeter you have to specify it.
#2 – The Amount of Load in Which We See Failures in the Results is Similar
As we did not try to split hairs, we did not look for the exact amount of users before which it is saturated, the order is the same, there is no significant difference. With both tools, the load of 4,000 virtual users was generated, where we began to see that the HTTP requests failed, which indicated that the results can not be trusted. This actually happened due to saturation as much as on the generator side as the server side, but by looking at the resources, the main saturation was observed on the laptop where the load generator was running.
#3 – Number of Users That Each Tool Can Generate Without Saturating the CPU
Although it seems absurd, the maximum number of virtual users that can be generated without reaching 100% CPU of the machine with which the load is generated is 4. This is the same with both tools, and running 5 concurrently “eats up” 100% of the CPU during the whole test.
This is explained by the fact that they are requests one after another, without pauses between each and the responses are almost immediate, whereby each thread is constantly working. I expected a very different result in this regard, but that was how it turned out.
#4 – Faced with a Different Load of 4,000 Virtual Users, There Was a Different Use of Resources
Let’s look at the basic monitoring graphs produced on the laptop of the load generator to analyze the differences. First, the execution of JMeter marked in red: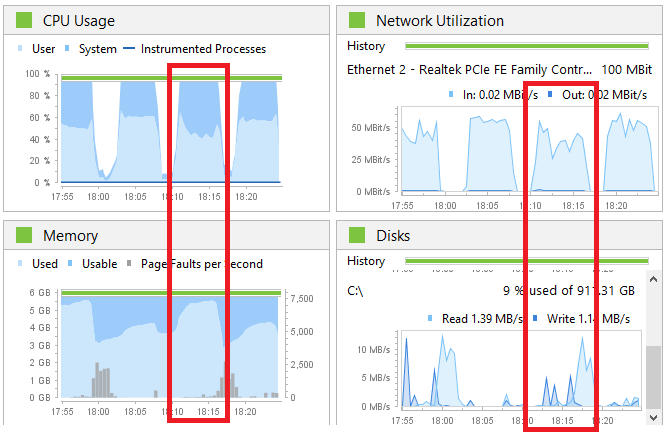
Then the execution with Gatling marked in red:
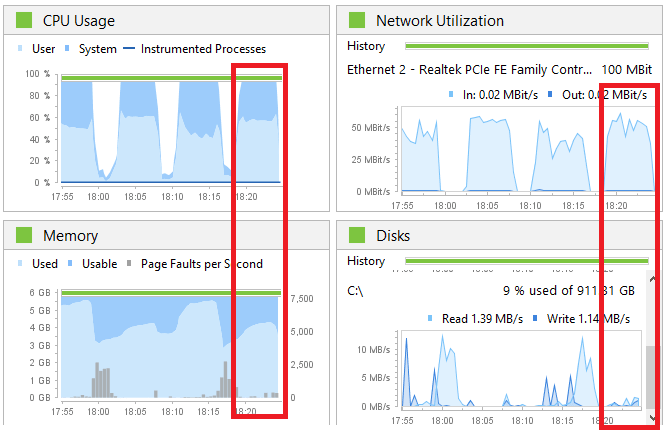
Observations
- Although both were using 100% of the CPU, in the case of JMeter there was a greater use of CPU by the system, which could be due to it having more threads to handle the virtual users.
- Gatling uses less memory than JMeter. You can see in the graph that JMeter uses almost 100%, or almost 6GB, and Gatling uses a little more than 4GB, or about 30% less. This could also be explained by the handling of threads, since Gatling needs fewer threads in memory than JMeter for the same number of virtual users.
- Gatling seems to use more network, which would not make sense unless it generated more load. If JMeter generated less load, it is because it was more saturated and perhaps it could not execute with the same intensity as Gatling.
- Gatling used less disk than JMeter, and the curious thing is that the majority in JMeter are readings. Here we are lacking a little more analysis to see what is the reason for this difference, but since it doesn’t mean it’s a bottleneck, we did not find it too important.
In Closing
In conclusion, while there is not much difference between the load supported by Gatling and JMeter, the latter requires extra initial configuration and also uses about 30% more RAM than Gatling.
Do you have any similar experience with the tools to share?
Recommended for You
Gatling Tool Review for Performance Tests (written in Scala)
Why Performance Testing is Necessary