Learn how DORA metrics can boost software delivery speed and stability in your organization. Improve business value through DevOps with Abstracta’s expert support.

The need to measure and optimize every stage of the delivery process is crucial for maintaining organizations’ competitiveness and quality. Why? The answer is simple: for the tech teams, showcasing the value we bring to the organization is essential.
This is where DORA metrics come in—a set of indicators designed to measure how quickly and reliably our systems are running. At Abstracta, we’re committed to helping our clients adopt these metrics to build a solid DevOps culture.
By focusing on data, we’re able to continuously improve and create real synergy between development and operations. This gives us a quantifiable view of our software delivery performance and, as a result, our overall organizational performance, empowering us to make better decisions.
Optimize your DevOps culture with DORA metrics, together with Abstracta.
Contact us to learn more!
What Are DORA Metrics?

DORA (DevOps Research and Assessment) metrics are indicators that measure software delivery performance for DevOps teams and organizations, focusing on speed and stability. They help spot improvement areas and make data-driven decisions to enhance delivery speed, product quality, and operational efficiency.
The 4 Key DORA Metrics
Each DORA metric provides insight into a different part of the delivery pipeline, helping teams detect inefficiencies and guide continuous improvement:
- Lead Time for Changes: Time from code commit to production. Reflects how quickly teams respond to change.
- Deployment Frequency: How often new code is deployed. Indicates the team’s ability to deliver updates continuously.
- Mean Time to Restore (MTTR): Average time to restore service after an interruption. Highlights system resilience and incident response speed.
- Change Failure Rate: Percentage of deployments that result in failure. Measures the reliability of releases and testing effectiveness.
These four Dora metrics align with two core dimensions of DevOps performance: speed and stability.
The Fifth Dora Metric: Reliability
The original DORA framework introduced the aforementioned four metrics in the Accelerate book (2018). In 2021, the DORA team added a fifth metric—Reliability—to reflect overall system health, including availability, latency, and error rates. While not part of the original “four keys,” this metric is now used by many organizations to complement the core DORA metrics and enhance observability in software delivery performance.
DORA Metrics: Speed vs. Stability
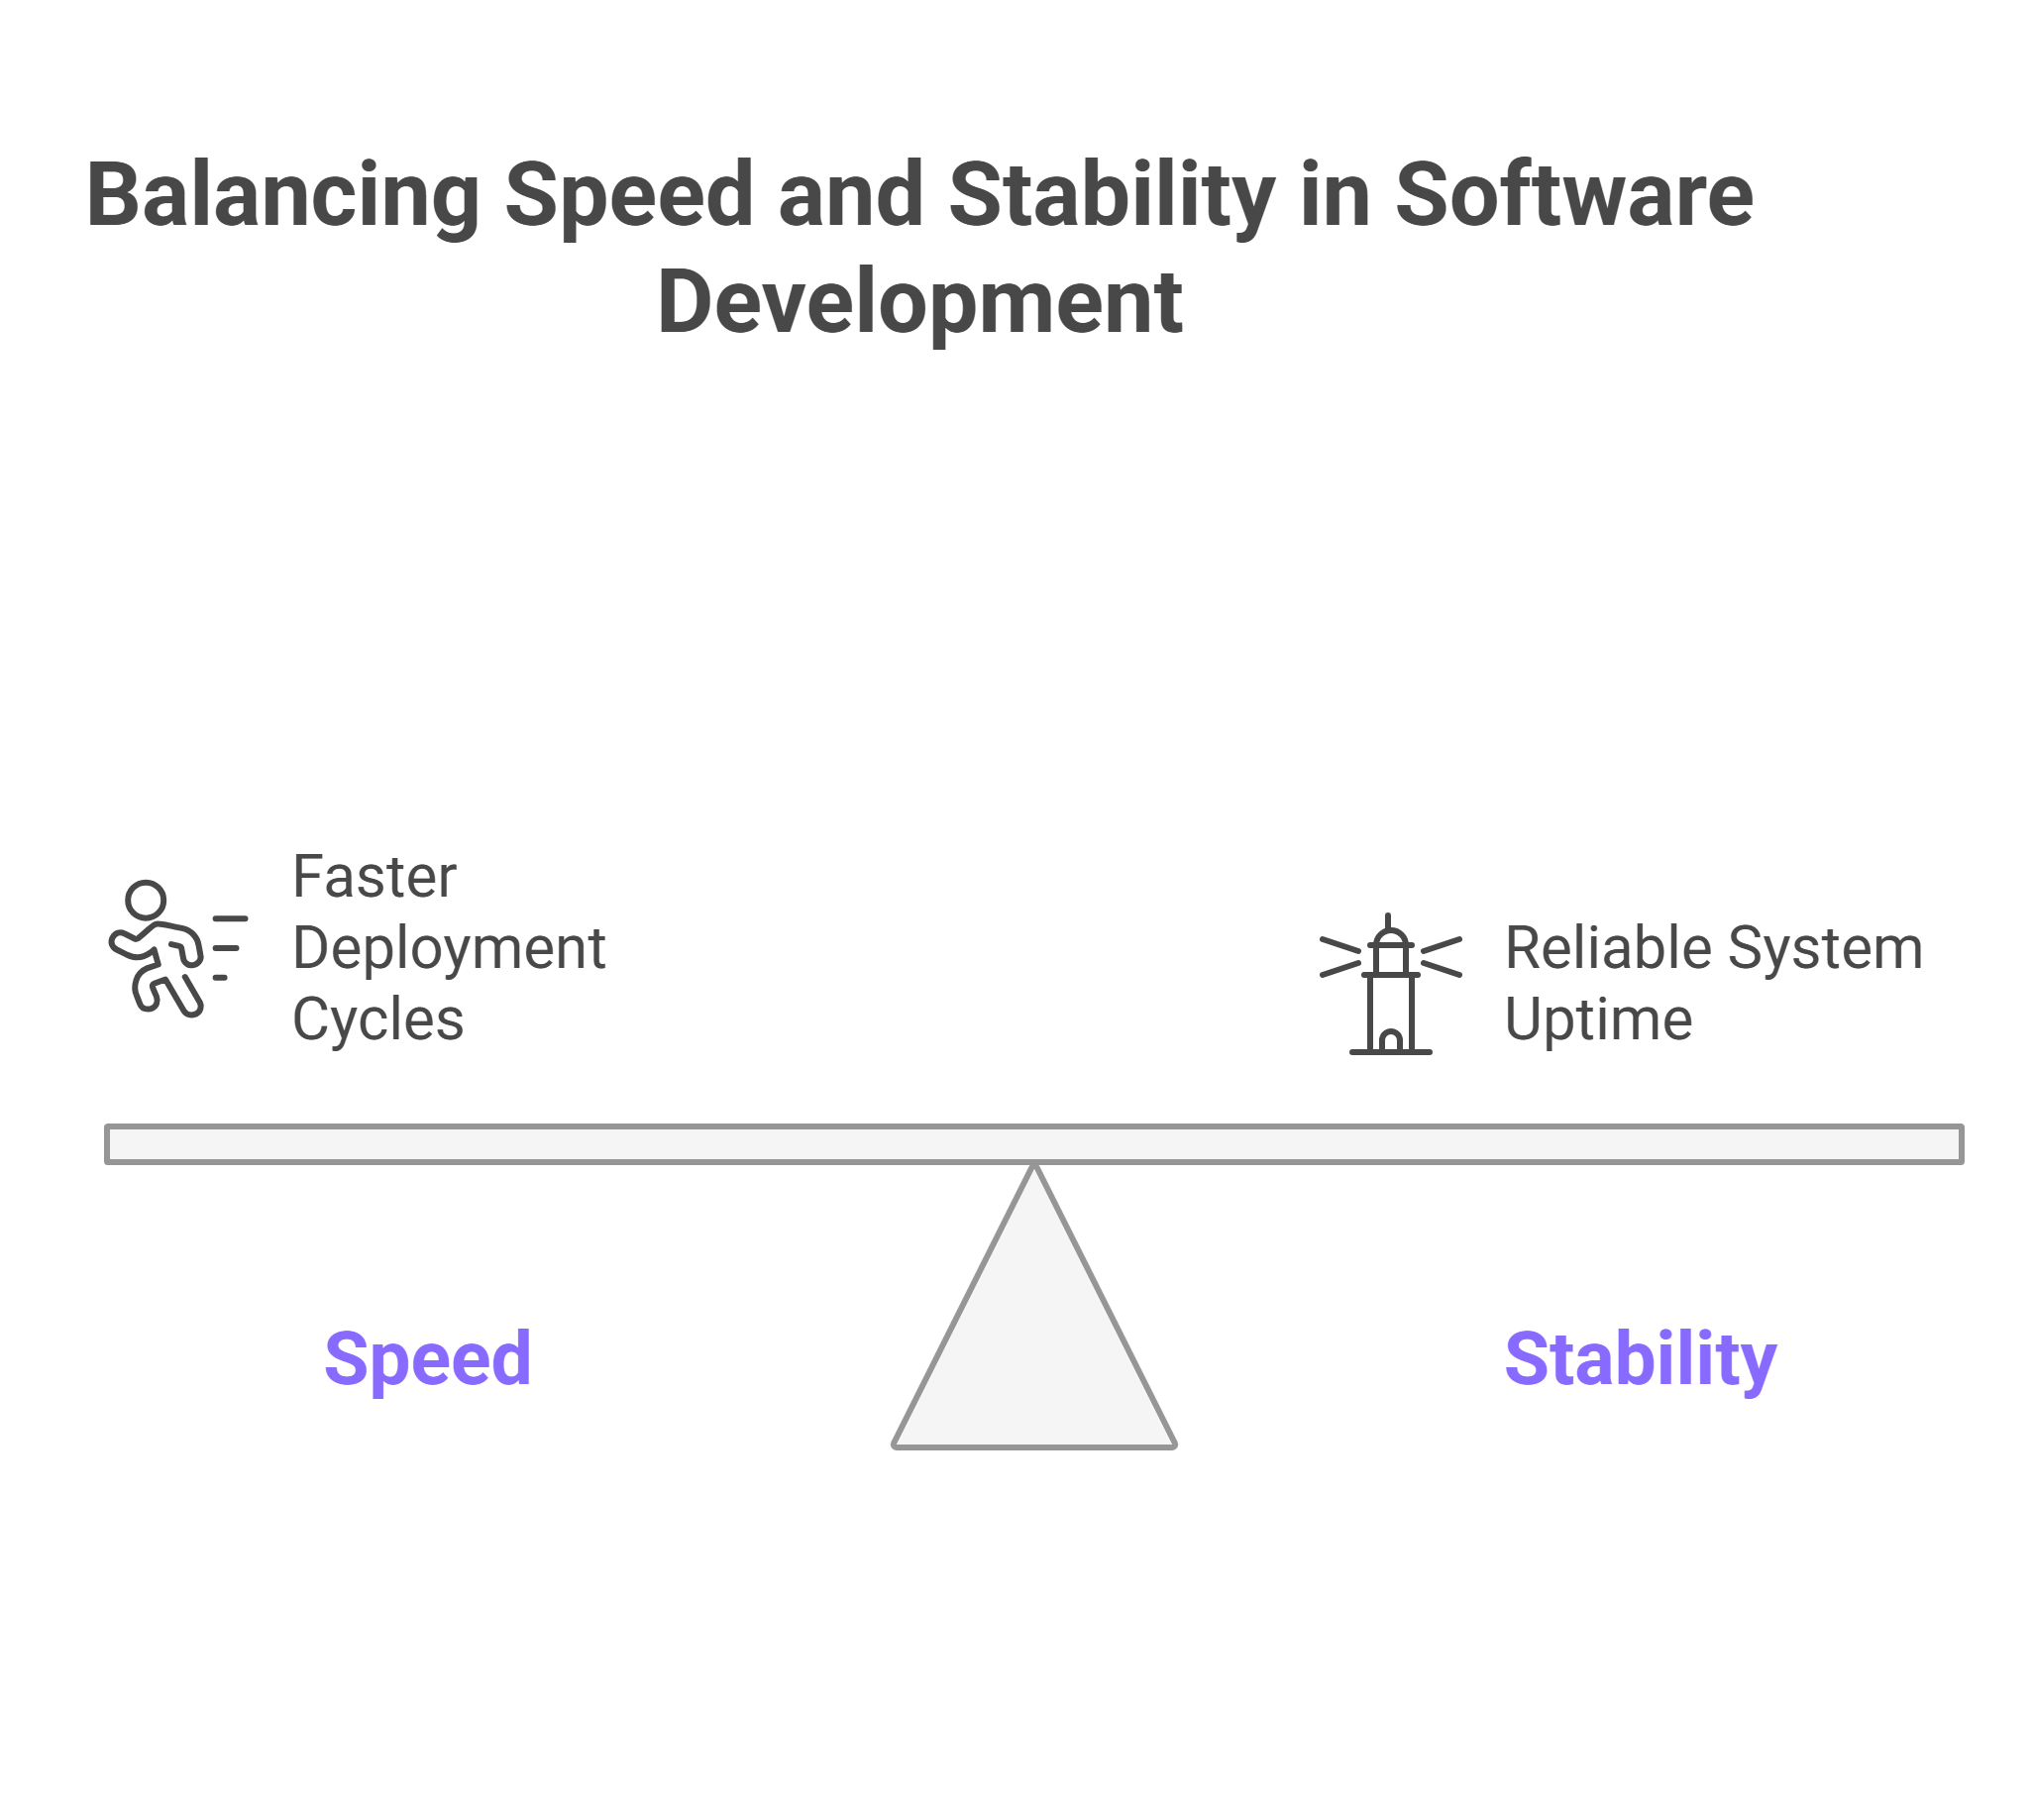
DORA metrics fall into two key categories: speed and stability. Each reflects a different but complementary dimension of software delivery performance. Understanding the balance between them is essential for building effective DevOps practices.
Speed
Speed metrics show how fast a team can deploy changes to production. They reflect agility and responsiveness in the software delivery process. Lead Time for Changes and Deployment Frequency fall into this category.
Stability
Stability metrics help evaluate how changes affect service continuity. They focus on uptime and reliability to reduce disruption and support consistent performance. Mean Time to Restore (MTTR) and Change Failure Rate belong to this category.
A common question often arises: Are speed and stability in conflict?
Why Speed vs Stability?
While speed and stability might seem opposed, in DORA metrics, they represent complementary aspects of software delivery. High-performing teams optimize both, balancing rapid iteration with reliable operations.
Revolutionize Your Testing with our AI-powered assistant Abstracta Copilot!
Book a meeting and talk with our experts about how we can support you.
Recommended Tools for Measuring DORA Metrics
To accurately measure each of the four key metrics of DORA, we recommend a few specific tools at Abstracta that help obtain precise and reliable data capture. With these tools, development and operations teams can track each aspect of the software delivery process and identify bottlenecks that may be holding back their efficiency.
Tools for Measuring Speed in DevOps
Lead Time for Changes
- Tools: Git, Jenkins, Redmine.
- How to Measure: Track the time elapsed from commit to deployment.
- Tip: Periodically review and adjust measurement points based on team and project growth.
Deployment Frequency
- Tools: Jenkins, DevOps, GitLab, Docker, Nexus.
- How to Measure: Count the number of deployments made within a defined period.
- Tip: Continuously monitor this metric and adjust the frequency according to business goals and team capacity.
Tools for Measuring Stability in DevOps
Stability is critical in DevOps. That’s why we use specific tools to track each resilience-related metric.
Mean Time to Restore
MTTR measures the time it takes to restore the system after a failure, and reducing it is key to service stability.
- Tools: PagerDuty (Zabbix), Prometheus, Grafana, ELK, Glowroot.
- How to Measure: Calculate the time from when an interruption is detected to when the service is restored.
- Tip: Set up proactive alerts and keep a detailed incident log to detect patterns and areas for improvement. At this point, it’s crucial to make sure the service is available so users can operate without interruptions.
Change Failure Rate
To reduce the failure rate in production, it is essential to identify the root causes of failures and address them directly.
- Tools: Redmine, XWiki, Jenkins.
- How to Measure: Calculate the percentage of deployments with critical failures. To do so, it’s important to define what constitutes a critical failure for each context and team.
- Tip: Analyze the causes of each failure to implement mitigation strategies and improve QA processes.
How We Implement DORA Metrics in DevOps

At Abstracta, we’ve created a four-step process for implementing DORA metrics that helps engineering leaders and their teams align their goals with improved software delivery performance. This approach is tailored to the unique needs of each software development team and focuses on driving continuous improvement.
Step 1: Initial Assessment
We start by selecting a pilot project. This allows us to analyze the current state and set baseline values for each metric.
- Tool and Process Analysis: We assess existing tools and their fit for the project.
- Initial Check: We do a quick check on DORA’s official site.
- Baseline Metrics Definition: We establish initial values for lead time, deployment frequency, MTTR, and change failure rate.
Step 2: Tool Implementation
We select and integrate the necessary tools to start capturing precise data.
- Tool Selection: We choose the tools that best fit the team’s needs. Options include Zabbix, DevLake, DataDog, and DORA documentation.
- Configuration: We configure each tool to capture real-time data.
Step 3: Monitoring and Adjustment
We set up a continuous monitoring system and review data regularly to identify areas for improvement.
- Continuous Monitoring: We configure monitoring systems for each metric.
- Periodic Review: We conduct monthly reviews to adjust and optimize the process.
Step 4: Optimization
We use the data collected to analyze patterns and establish improvements.
- Pattern Analysis: We identify trends in the data to improve processes.
- Implementation of Improvements: We make adjustments based on analyzed data to optimize results.
Prioritizing DORA Metrics at Abstracta

To achieve quick, meaningful results, we prioritize speed metrics in the initial phase, as they tend to have an immediate impact. Once the speed is optimized, we focus on stability metrics to achieve a continuous, resilient software delivery.
At Abstracta, we know that measuring DORA metrics lets us proactively respond to market changes. That’s why, as we drive DORA adoption, we focus heavily on artificial intelligence.
By automating complex tasks and analyzing patterns to help our engineering teams and clients anticipate issues and make strategic DevOps decisions, AI complements DORA metrics. In this way, we achieve synergy between speed, stability, and advanced technology.
DORA 2024 Report and AI Impact
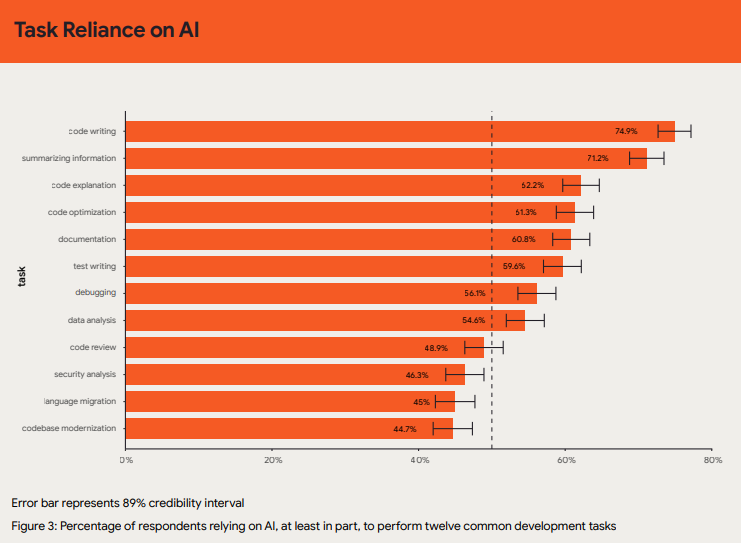
The adoption of artificial intelligence (AI) in DevOps is transforming how DORA metrics are implemented and monitored. According to the DORA 2024 report, over 75% of those surveyed—including development, DevOps engineering, and IT leadership professionals—use AI tools for daily tasks like:
- Writing code
- Summarizing information
- Explaining unfamiliar code
- Optimizing code
- Documenting code
- Writing tests
- Debugging code
- Conducting data analysis
Another notable finding is that a 25% increase in AI adoption is associated with a 7.5% improvement in documentation quality, a 3.4% improvement in code quality, and a 3.1% improvement in code review speed. However, this increase also correlates with a 1.5% reduction in delivery performance and a 7.2% decrease in delivery stability.
Why Are These Results Important?
These numbers not only point to the future but also highlight emerging challenges. Knowing both the benefits and the potential impacts of AI in DevOps helps organizations make balanced decisions, plan strategies to mitigate risks, and maintain a competitive edge while maximizing the benefits AI offers for transforming software development.
In this context, DORA metrics are a powerful tool for development teams and QA areas looking to optimize their work and demonstrate their value within their organizations.
How to Improve DORA Metrics

DORA metrics are a great way to see how well we’re delivering value to our users, but they don’t really tell us how to get better. That’s where Abstracta’s continuous delivery methodology comes in. It gives us a clear roadmap to boost both the speed and stability of our tech deliveries.
It might not seem obvious at first, but you can actually achieve high speed and great stability by implementing automations throughout the process. This approach not only streamlines the workflow but also cuts down on human errors and boosts overall efficiency.
The trick is to adopt a continuous testing model. This way, you can spot and fix issues quickly before they ever reach the end user. By automating tests and deployments, we thoroughly check and roll out every code change smoothly.
Plus, continuous delivery encourages a culture of constant improvement and teamwork, leading to a higher quality product and a better user experience. At Abstracta, we’ve seen firsthand how this approach not only improves our DORA metrics but also sparks innovation and agility in our projects.
In Short
DORA metrics give organizations a clear and quantifiable view of their DevOps performance. At Abstracta, our approach is to adapt these metrics to each team’s specific needs. We pay special attention to the growing use of AI to enhance the efficiency and quality of delivered software, making data-driven decisions.
With the results in hand, it’s possible to improve these metrics by enhancing continuous delivery practices and implementing automation throughout all phases of development. This approach speeds up value delivery and enables greater stability and quality in our tech products.
FAQs about Dora Metrics

What Are the 4 Key DORA Metrics?
The four key DORA metrics are Lead Time for Changes, Deployment Frequency, Mean Time to Restore, and Change Failure Rate. They assess software delivery throughput, helping DevOps teams increase velocity, reduce risk, and release stable updates more effectively.
What Are the 5 DORA Metrics?
The five DORA metrics are Lead Time for Changes, Deployment Frequency, Mean Time to Restore, Change Failure Rate, and Reliability. Added in 2021, the fifth metric reflects system health and experience, enabling teams to improve delivery reliability and decision-making.
What Are the Metrics of DORA Flow?
DORA flow metrics track how software moves through the delivery pipeline. Lead Time for Changes and Deployment Frequency measure speed, while Change Failure Rate and MTTR reflect stability and recovery time.
What Is the Full Form of DORA?
DORA stands for DevOps Research and Assessment. It refers to a framework developed by Google’s research team that uses performance metrics to improve software delivery and operations.
How Do DORA Metrics Predict Organizational Performance and Team Well‑Being?
DORA metrics help DevOps and engineering teams measure team performance and workflow efficiency. By tracking outcomes, teams improve their business outcomes and make meaningful improvements aligned with industry benchmarks.
What Are the Key Differences Between Throughput and Stability in DORA Metrics?
Throughput metrics include deployment frequency, lead time, while stability relates to incident management. Together, they reflect the balance required for a successful deployment and strong quality assurance practices.
How Can I Improve My Deployment Frequency Using DORA Insights?
To achieve a higher deployment frequency, teams should adopt automated testing and improve code review processes. These changes help average teams transition toward more resilient software delivery pipelines.
Why Is Reducing Change Lead Time Crucial for DevOps Success?
Reducing lead time accelerates feedback and improves the software development process. It also supports value stream management, particularly for multidisciplinary teams aiming for rapid iteration and delivery.
How Do Change Failure Rate And Recovery Time Reflect System Reliability?
These metric measures are part of the core four metrics. They demonstrate how reliably an organization can successfully release software under pressure and recover from failures.
Why Do Low-Performing Teams Struggle To Improve Delivery Metrics?
Low-performing teams often fail to collect data consistently or adopt structured gathering data practices. This limits visibility and slows down metric-driven improvement strategies.
How Do Key Metrics Help Software Organizations Structure Their Workflows?
Software organizations rely on key components like tracking other DORA metrics and creating smaller pull requests to refine workflows and improve stability over time.
How We Can Help You

With over 16 years of experience and a global presence, Abstracta is a leading technology solutions company with offices in the United States, Chile, Colombia, and Uruguay. We specialize in software development, AI-driven innovations & copilots, and end-to-end software testing services.
At Abstracta, we implement DORA metrics tailored to your team’s and projects’ specific needs. Our approach spans from tool configuration to continuous optimization, focusing on each metric’s tangible value. As part of this path, we integrate AI and advanced DevOps practices.
Our expertise spans across industries. We believe that actively bonding ties propels us further and helps us enhance our clients’ software. That’s why we’ve forged robust partnerships with industry leaders like Microsoft, Datadog, Tricentis, Perforce BlazeMeter, and Saucelabs.
Visit our DevOps solution page and contact us to discuss how we can help you grow your business.

Follow us on Linkedin & X to be part of our community!
Recommended for You
Healthcare Software Development Solutions: A Comprehensive Guide
Adaptive Software Development (ASD) for Complex Projects
Better Your Strategy with This Software Testing Maturity Model