An overview of free tools to process logs for performance that we created for Apache, IIS, and other web servers
Our tools, Replace All and Access Log Analyzer are open and free, located in our Github repository.
Some time ago, Símon de Uvarow, (performance expert) started automating tasks to process logs in order to carry out performance analyses. These tasks are necessary, mainly when we do not have –usually due to a matter of costs- tools to solve the monitoring and analysis tasks automatically (like AppDynamics or New Relic). We need to have more data on the causes that generate the bottlenecks in the system and that is the main motivation behind developing these tools.
Below is a description of each tool, with some examples of what we can do with them, along with the access to the source code in Github.
Abstracta.ReplaceAll
This application, used with command line, was developed on the .NET framework, and may be used to modify a file’s format, line by line, with special options for the usual formats of logs, so that the output may be processed with worksheets. It enables the processing of simple texts and the use of regular expressions, as well as references within the file.
Example 1
We wish to replace “hello” with “good-bye” on line 2. We should invoke the program as follows:
Abstracta.ReplaceAll.exe -i example.log -r “hello” -w “good bye” –fromLine 2 –toLine 2 -o “resultFile.log”
Example 2
The following is a more actual example of how to apply the tool to a log, where we want to replace “month/day/year” with “day/month/year” throughout the whole file.
To do so, we should invoke the following:
Abstracta.ReplaceAll.exe -i example.log -x -r “(^S+ )(dd)/(dd)/(dddd .*$)” -t -w “$1$3/$2/$4”
The -x parameter indicates a regular expression, and -t indicates that a template is to be used for the output.
For this input:
172.19.2.75 01/16/2013 00:00:06 /manager/html 200 47
172.19.2.75 02/17/2013 00:00:36 /manager/html 200 16
172.19.2.75 03/18/2013 00:01:06 /manager/html 200 0
The output generated would be the following:
172.19.2.75 16/01/2013 00:00:06 /manager/html 200 47
172.19.2.75 17/02/2013 00:00:36 /manager/html 200 16
172.19.2.75 18/03/2013 00:01:06 /manager/html 200 0
Everyone who has had the need to process logs has surely faced this problem, so here we have a useful simple tool.
Abstracta.ReplaceAll – Download source code
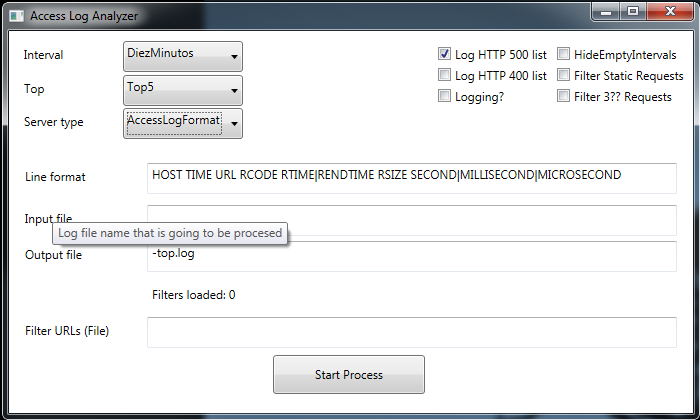
Abstracta.AccessLogAnalizer
Another application in .NET that may be used through its graphic interface or with its line of commands. It was meant to be used together with ReplaceAll. It enables the possibility of working with the logs that record HTTP requests and their response times, to, for example, group them into intervals of time and then keep the slowest ‘n’ requests of each interval.


It enables the definition of filters by URL. We are currently working on the definition of filters by response code, size, and client name, among others.
At present, it directly supports the formats of Apache Tomcat and IIS logs, and a specific format into which any access log may be converted by using the ReplaceAll.
It is possible to define intervals between 1 and 120 minutes. The tools divides the log into those intervals and calculates statistics for each one. For example, when we have the access log of a whole day of executions, we may decide to divide with a granularity of minutes and we will have 1440 intervals (the number of minutes in one day). For each interval, the following information will be calculated:
- Total number of requests.
- #Requests with response code 3XX.
- #Requests with response code 4XX.
- #Requests with response code 5XX.
- #Requests with response time between 0 and 2 seconds.
- #Requests with response time between 2 and 4 seconds.
- #Requests with response time between 4 and 6 seconds.
- #Requests with response time between 6 and 8 seconds.
- And the same with categories = {10, 15, 20, 30, 40, 60, 80, 100, 120, int.MaxValue }.
- Slower URLs of each interval.
- All URLs with response code 5XX (error in the server).
We are also working on:
- Reports with graphs, rather than just text
- Processing of more than one access log in a single analysis, so as to compare what occurred between different servers, as it happens in the case of a farm or behind a balancer
- Processing of compressed files
- More filters
Abstracta.AccessLogAnalizer – Download source code
Please, use these tools and provide us with feedback after downloading the code. We appreciate all comments and hope you find them useful!
There are other tools we have published in Abstracta’s Github repository, which we will be commenting on in future posts, giving more examples and documentation.
Recommended for You
Top 10 Tools We’re Most Grateful for this Thanksgiving [Infographic]
Types of Performance Tests
Tags In


Sofía Palamarchuk, Co-CEO at Abstracta
Related Posts
Quality Sense Podcast: Oren Rubin – Web Test Automation Challenges
Looking at some of the challenges of test automaton and how to pick the best tools and infrastructure In today’s Quality Sense episode, Federico Toledo sits down for a chat with the founder and CEO of Testim, Oren Rubin, an Israeli entrepreneur who has over…
Alerts in New Relic Synthetics: Check Website Health From Different Parts of the World
Use the tool, Synthetics, for easy website health monitoring New Relic is a company that offers many different tools, perhaps best known for its application performance monitoring (APM). At least that’s what I know it best for since we often use this tool when we…
Search
Contents
Categories
- Acceptance testing
- Accessibility Testing
- AI
- API Testing
- Development
- DevOps
- Fintech
- Functional Software Testing
- Healthtech
- Mobile Testing
- Observability Testing
- Partners
- Performance Testing
- Press
- Quallity Engineering
- Security Testing
- Software Quality
- Software Testing
- Test Automation
- Testing Strategy
- Testing Tools
- Work Culture


