How to run a code analysis from Maven or an IDE
In part two of this blog series on code analysis, I showed you how to do a proof of concept quickly using a SonarQube Docker image, and run the analysis from SonarQube Scanner. In this third and final post, we will see two SonarQube alternatives: Maven and an IDE.
Running the Analysis with Maven
To begin with this process, the first thing you must do is add the SonarQube plugin to your Maven project as follows:
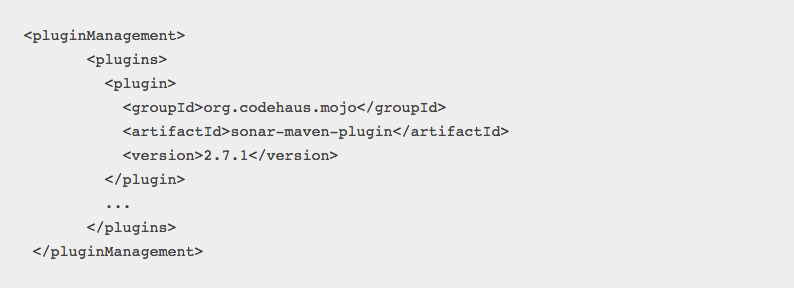
(This is for Maven 2, for Maven 3 check here).
At this point you have everything necessary to perform your code analysis from Maven, so it will perform the analysis in the SonarQube server that you have already installed in a Docker container (explained here).
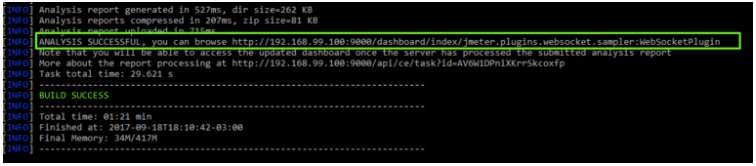
Then, all that remains is to go to the directory of your project and execute the Maven goal with the following command:
mvn sonar:sonar -Dsonar.host.url=http://docker-ip:port
The name of the project in SonarQube and the version is taken from the Maven project (at the beginning of the pom file). See the documentation about the parameters here.
As a result, you will see something like this:
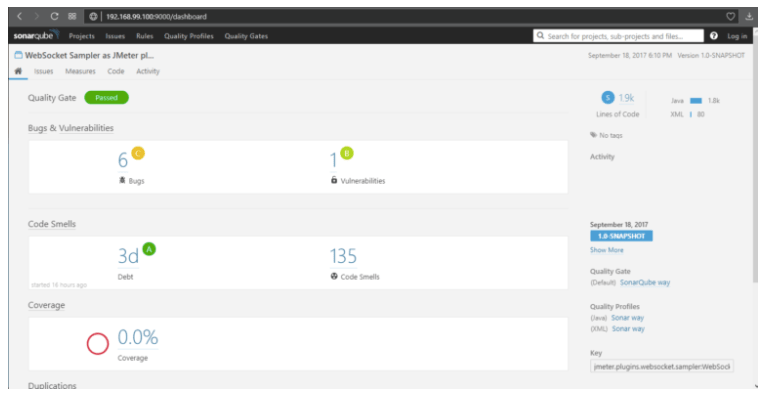
In this way, you’ll obtain your SonarQube-generated report:
Running the Analysis in an IDE
This other method will allow you to execute the analysis directly from the IDE of your preference. Particularly here we will show you the use of the SonarLint plugin for IntelliJ, but it’s equivalent for other development environments such as Eclipse or Visual Studio.
SonarLint in IntelliJ
The first thing is to download the SonarLint plugin from the IntelliJ plugin manager. Once installed, proceed with the configuration.
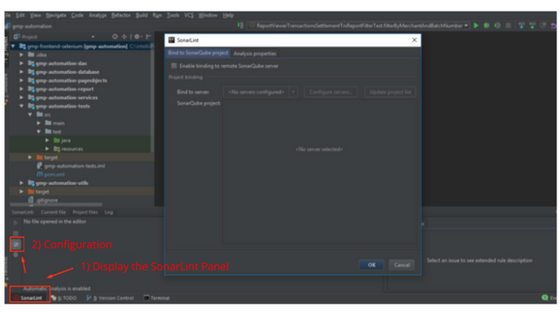
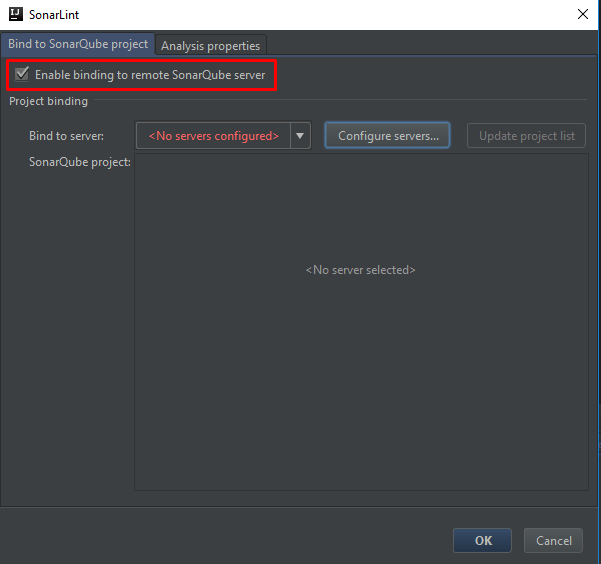
Select “Enable binding to remote SonarQube server” and then select “Configure servers”.
Then add a server, entering the IP and the port of the server:
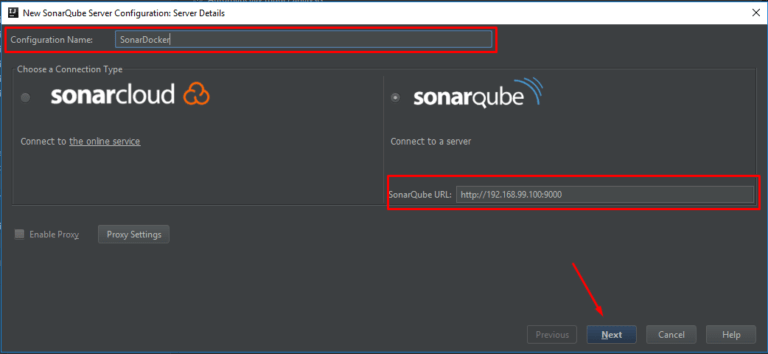
Select authentication through username and password, entering the corresponding credentials. After advancing in the wizard, choose some of the existing projects in the SonarQube server to link it.
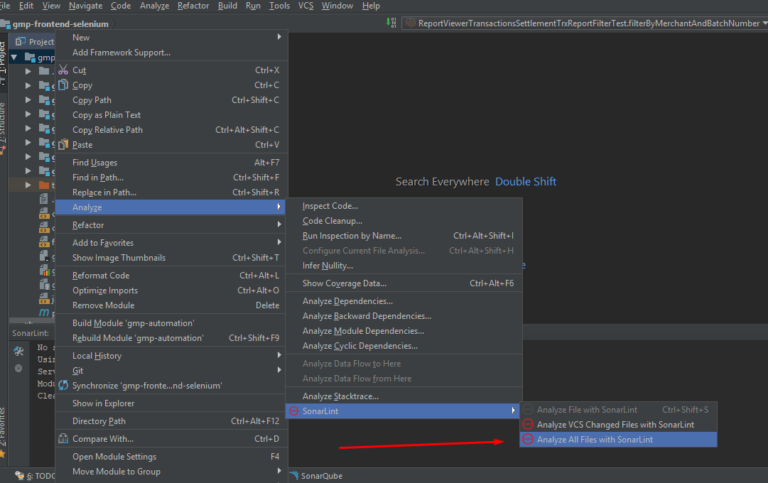
At this time you can proceed to analyze the project you want:
Obtaining a result as shown below:
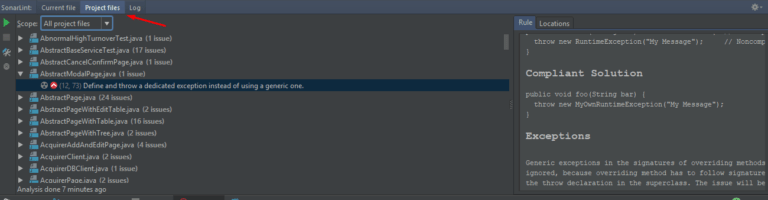
After executing the analysis, you can go to your code and SonarLint will mark the errors or possible corrections to be made as if it were a syntax error marked by the IDE itself.
What a surprise it is to see all the failures that SonarQube reports, no!? You can learn a lot by incorporating this tool early in a project. What do you think?
Recommended for You
Code Analysis Part 1: What You Should Know About Technical Debt
Code Analysis Part 2: Analyzing Code with SonarQube

7 Can’t-Miss Sessions on Performance at the CMG imPACt Conference 2016
We’re attending one of the hottest conferences for performance professionals. You should too! Dubbed “the best performance conference ever” by respected performance guru, Alexander Podelko, the annual conference, CMG imPACt 2016, is taking place this November 7th through the 10th in San Diego’s not-so-secret hidden gem, La…

Automatic Checks with Scriptless Tool, Ghost Inspector
Ghost Inspector review: Tool to automate tests without the need for coding skills We just started a new project with a client from Silicon Valley in e-commerce where one of the first things we’re working on is to review their current testing strategy, and within that, their…