OverOps, the self-proclaimed “God mode for production code”
We are happy to share a new tool that we are excited about here at Abstracta, OverOps! Why? Well, simply put, it makes it easy to see where, when, and why your code breaks in production. My colleagues first learned about it at the Velocity Conference this past June in Santa Clara, and more recently, we’ve been getting to know how it works more in-depth. In this post, I’ll share how it can be used for debugging in production.
OverOps captures errors and exceptions in any application that works in the Java Virtual Machine, such as Java, Scala, Closure, etc. and records information that facilitates the reproduction and resolution of the problem. Among other things, it registers the line of code where the error is reproduced as well as the values of the variables and attributes at that moment. What’s great is that OverOps plans to add more languages in the future and by the end of the year, it will be ready for .NET.
This two minute video provides a quick overview of OverOps:
How to Install OverOps
The installation process varies between operating systems, but in general, it’s very simple. First, you have to create an account on the OverOps website and follow the installation steps from there.
For example, if you are installing on Windows:
- Download and run the installer (an executable), which installs fairly fast. You’ll have to put a secret key to link the OverOps server to the machine where the application to be monitored is housed.
- Connect to the Java Virtual Machine. For that you have to add “-agentlib: TakipiAgent” to the Java arguments when you open the application.
After completing these two steps, the tool should work. In the tool installation window (in step 2) there is a button to check the connectivity of OverOps with the application to be monitored:
![]()
If after completing these steps, it still isn’t working, check if the Java Virtual Machine took the -agentlib: TakipiAgent argument when opening (with JConsole for example or command line) or see that the downloaded program has been installed correctly in step 1.
Monitoring with OverOps
The OverOps main page presents a grid where all the exceptions recorded so far are shown, grouping all the times that the same exception occurs in a single element. They can be ordered according to several criteria, the most useful being:
- Number of times error occurred
- Percentage of error versus the total number of calls of that code
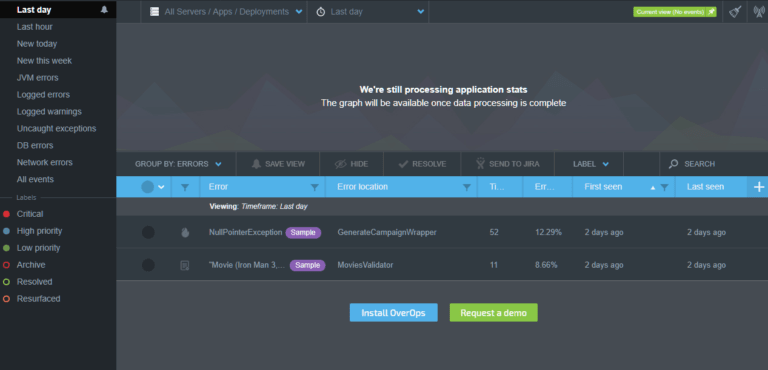
You can also group the errors according to:
- The server
- The application
- The deployment made
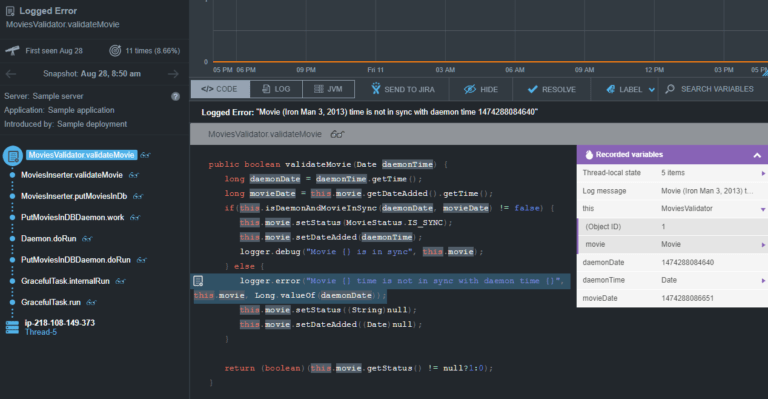
If you click on one of the particular errors, you can see useful information to correct them, including:
- The call stack where the trace of executed methods is displayed until it reaches the error
- The code executed, in particular, the line where the error occurs is highlighted
- The state and value of the variables at the time of the error
- Status of the JVM (memory, threads, etc.)
- The last lines of the output log, which will surely be related to what occurred
A helpful feature that it provides for a production environment is that it enables you to generate alerts for developers so that they can investigate and fix problems as soon as possible.
Can it Actually Be Used in Production?
It’s important to highlight here that all of this can be done at very little cost, and since it’s not intrusive, it can be done in production. OverOps is low storage and ensures that it never adds more than 1% network overhead. In the case that it detects it would consume more, it cancels the storage of information.
OverOps is similar to Microsoft’s Intellitrace, but with a more efficient mechanism for instrumentation. The problem with Intellitrace and debugging in production is addressed in this post:
“With either plan, we recommend that you start IntelliTrace data collection, reproduce the problem, and then stop collection. You can take resulting log that IntelliTrace creates, open it in Visual Studio 11 Ultimate, and analyze it.”
Essentially, Microsoft recommends only activating Intellitrace to get the data so you can analyze it later in Visual Studio. Instead, OverOps is designed for production, enabling you to analyze the problems in the web console (so it’s not necessary to do the analysis in a development IDE).
The Verdict for Testers
We find this to be an interesting monitoring tool, different from those we’ve typically used in our performance testing arsenal, that can add value in projects where a production emergency has to be solved. It reduces the need to reproduce errors, and you can solve them directly from the code since you have the status info of the variables related to the problem.
To take full advantage of it, testers should use it in conjunction with developers, since the most relevant information refers to the application code. This is yet another way testers can be involved with tasks close to the code, which relates to what we wrote about regarding the hands-on role of the quality engineer. It could also be very useful in the testing stage for finding and fixing functional bugs.
If you want to try it, we can lend a hand and even contact the OverOps team.
Tell us, have you used it or plan on trying it? Let us know what you think of this tool!
Recommended for You
[Infographic] What is a QE?
Performance Testing in Production

Software Tester, Among the Jobs in The Future of Work
Millions of new jobs will be created as a result of the Fifth Industrial Revolution. A software tester will be one of the jobs of the future as the world embraces digital transformation. The digital transformation has driven the creation of new jobs, which until…
Developer’s friendly tools for continuous performance testing
How many times have we seen a test infrastructure and methodology where the team is not able to get early feedback about the performance of the system they are developing? Typically, it is expected to treat performance testing as a “waterfall project” where we, the…