Performance testing in CI is a must. Here’s what to take into account from day one.
Recently I gave a talk at Agile Testing Days USA in Boston, my first time attending this testing conference and I was extremely pleased with the event, the things I learned, and the people I had the opportunity to meet. For example, I got to know some of my Agile testing role models: Lisa Crispin, Janet Gregory, and Rob Sabourin, among others.
In this post, I’m going to share what I presented in my talk, Challenges to Effective Performance Testing in Continuous Integration. I’ll address three main challenges you may face and my recommendations for how to tackle them in order to implement a successful performance testing strategy in CI.
Let’s Cover the Basics
First Off, What is Performance Testing?
(If you’re already familiar with performance testing and the concept of continuous integration, go ahead and skip this part!)
Computer performance is characterized by the amount of useful work accomplished by a computer system considering the response times and resources it uses. We cannot only see how fast it is, because a system that is very fast but uses 100% of CPU is not performant. Therefore, we need to check both the front and back end; the user experience (the load speed I perceive, the velocity) and the servers’ “feelings” (How stressed do they become under load?).
Also, if we only pay attention to response times, we would only see the symptoms of poor performance, but what we want to find are the root causes in order to identify bottlenecks and then ways to eliminate them.
We perform load tests that simulate load (virtual users) in order to detect:
- Bottlenecks (What’s the “thinner” part of the system that causes the holdup in traffic?)
- The breaking point (After what amount of load does the system degrade severely?)
So, to put it simply, performance tests consist of load simulation and measurement to detect bottlenecks and the point at which a system crashes under load.
You can read about the different types of performance tests here.
What is Continuous Integration (CI)?
Continuous integration (CI) is a practice wherein each developer’s code is merged at least once per day. A stable code repository is maintained from which anyone can start working on a change. The build is automated with various automatic checks, such as code quality reviews, unit tests, etc. In this case, we will be analyzing a good way to include performance tests in the mix.
There are several advantages to CI, including the ability to ship code more frequently and faster to users with less risk. You can read more about how software testing looks in CI (aka testing “shifts left”) here.
Now that we understand performance testing and CI, let’s dive into the three challenges that you will face when getting started and my recommendations for each, based on my actual experiences in the field.
Challenge #1: Picking the Right Tools
There are several tools for load simulation that you can pick from. The ones that I have used the most, and are perhaps my favorite, include JMeter, Taurus, Gatling, and BlazeMeter.
How Load Simulation Tools Work
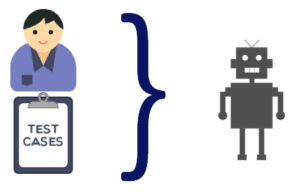
Load testing tools execute hundreds of threads simulating the actions that real users would execute, and for that reason they are called “virtual users.” We could think of them as a robot that executes a test case.
These tools run from machines dedicated to the test. The tools generally allow using several machines in a master-slave scheme to distribute the load, executing for example, 500 users from each machine. The main objective of this load distribution system is to avoid the overloading of these machines. If they overload, the test would become invalid, since there would be problems with simulating the load or collecting the response time data.
The graphic above shows how, from a few machines, you can run a large amount of load (virtual users) on a system.
What about the test scripts? Performance test scripts use the record and playback approach, but the recording is not done at the graphic user interface level (like for functional tests), rather the communication protocol level. In a performance test, multiple users will be simulated from the same machine, so it’s not feasible to open a large number of browsers and simulate the actions on them. Doing this at the protocol level can be said to “save resources,” since in the case of the HTTP protocol, what we will have are multiple threads that send and receive text over a network connection, and will not have to display graphic elements or any thing else that requires further processing.
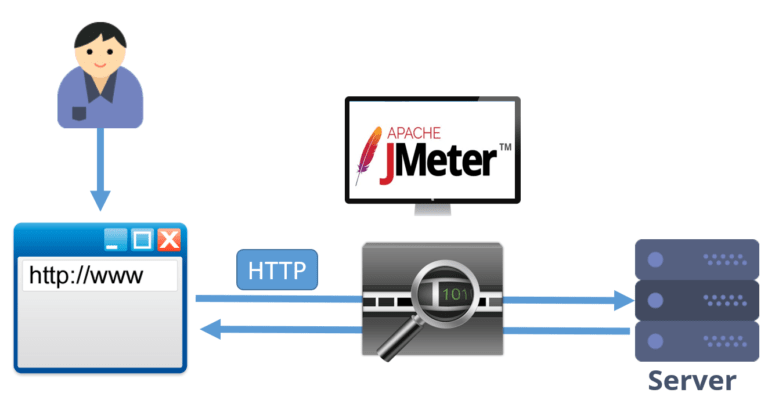
To prepare a script we proceed in a similar way to functional test scripts, but this time the tool, instead of capturing the interactions between the user and the browser, captures the HTTP traffic flows between the client and the server (HTTP or the protocol to be simulated, and the client can be the browser, a native app or whatever you want to simulate). Therefore, to automate, you’ll need knowledge of automation tools and communication protocols (HTTP, SIP, SOAP, ISO8583, etc.).
The image above shows what happens when the test is recorded with tools like JMeter. Basically, a proxy is opened that captures the traffic between the client and the server. The resulting script will be a sequence of commands in a language provided by the tool used, in which requests and responses are handled according to the communication protocol.
Once the script is recorded, it is then necessary to make a series of adjustments to these elements so that it is reproducible. These scripts will be executed by concurrent users (virtual users, remember?), and, for example, it does not make sense for all users to use the same username and password to connect, or for all users to do the same search (since in that case the application would work better than using different values, since there will be caches affecting the response times, both at the database level and at the Web application server level).
The effort associated with making this type of adjustment will depend on the tool used and the application under test. Sometimes it’s necessary to adjust cookies or variables, because those obtained when recording are no longer valid, and must be unique per user. Parameters must be set, for both the header and the body of the message, etc.
Note that with Taurus, we can specify a test with a very simple yml file and it will generate the code to run the test with JMeter, Gatling or around 10 other tools. You can combine different existing tests that you have in different tools, and aggregate the results. For this reason, I find it really innovative and useful.
So, which tool is going to be best for CI?
TAKEAWAY: Make sure to choose a tool that is CI friendly, which allows you to easily compare versions and detect differences using your Git repository manager (or the one you use). Gatling and Taurus are ideal options. Normally, I’m a proponent of JMeter, but the tests are stored as XML files. For CI, I prefer something based on code or simple text, making it all the easier to compare and detect differences.
Challenge #2: Testing Strategy
Defining the strategy is something that could be very broad, as we could consider various aspects. I like this definition below:
“The design of a testing strategy is primarily a process of identifying and prioritizing project risks and deciding what actions to take to mitigate them.” – Continuous Delivery (Jez Humble & David Farley)
I’m going to focus on just some aspects of a performance test strategy, particularly, what to run, when and where. What I want to show you is just a model to be used just as that, a model for reference. It was useful for me in some cases, so I hope it’s useful for you, or at least it can help to give you some ideas for creating your own model that fits your needs.
This model is based on the idea of continuous testing, where we want to run tests early and frequently. But we cannot test everything early and all the time. So, that’s when a model becomes useful.
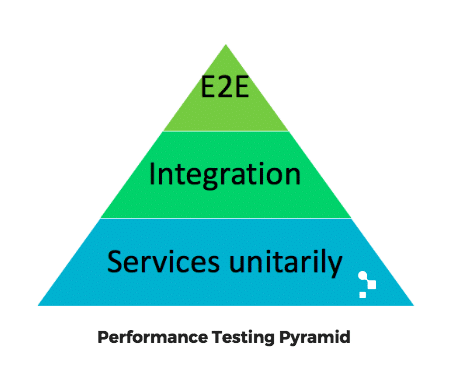
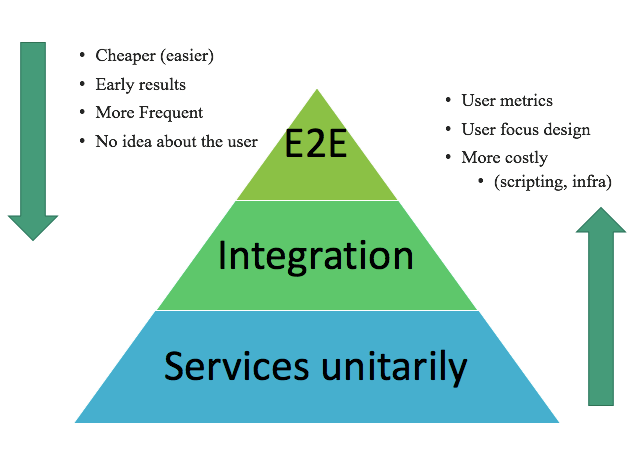
You may have heard of the test automation pyramid, well, I decided to create a pyramid for exploratory performance tests:
The What
Let’s take a look at the layers:
- End-to-end (E2E): This involves typical load testing, simulating real users, as I explained at the beginning of this post.
- Integration: We also want to test the services (assuming that we are talking about a very typical architecture where you have an API, rest, etc.) because we want to know how the services impact one another.
- Unit: We also want to test everything separately. If an integration test fails (because it detects a degradation), how can we know if the problem is that one service is impacting another, or if one has problems of its own? That’s why we test them unitarily first.
The pyramid represents graphically not only the amount of tests that you will have at each level, but also how often you should run them, considering a CI approach.
In any layer, we could have an exploratory testing approach. Which means, deciding what to test according to the previous test result, we just try different test configurations, analyze results, and based on what we get, decide again how to continue.
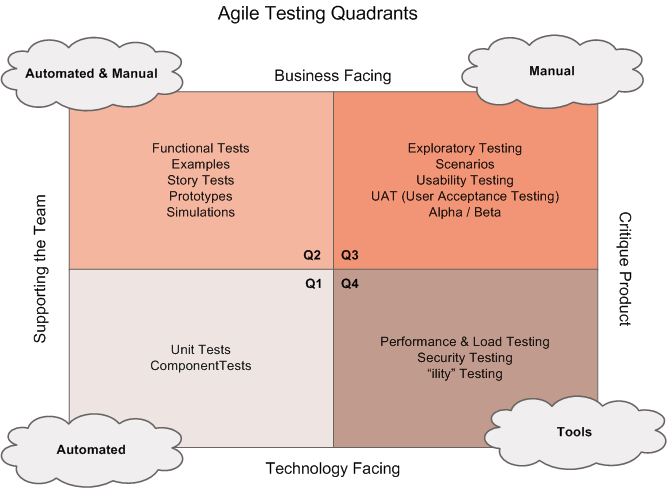
If we think of the agile testing quadrants (shown below), we are covering different quadrants here.
The end-to-end tests have a focus on the business, but the others are supporting the team, with some regression testing automated. The exploration critiques the product, and of course, everything is technology facing, because performance testing is highly technical.
From here on, I want to put the focus on regression testing, because this is what you have in the CI pipeline.
To compare and contrast the top of the pyramid with the bottom, at the bottom you have the following characteristics:
- Unit or API level which are less costly
- You can run them more frequently (every day) because they need less time to run, analyze and debug
- Performed earlier, because you don’t need to wait until all the layers are done, you can start as soon as you have some endpoints ready.
- The problem is that there is no correspondence with the response times that the real users will have
On the other hand, as you move up the pyramid, you have tests that:
- Allow you to validate performance for real users, since you model user behavior and involve infrastructure similar to that of production, causing them to provide better results
- So, they provide better results
- The problem is that they are more costly to prepare, maintain and analyze
The When
So that covers the “what” to run the performance tests. Next is the when? Or, how often?
In my opinion, it’s a good idea to do the end-to-end tests every couple of weeks, depending on how hard they are to maintain, integration tests once a week, and test the units daily. This is just an example that represents the relationship between the frequencies at each layer.
The Where
Next, what type of test environment do we need for each?
For end-to-end testing, we need an environment similar to production, to reduce risks (the more differences between the testing environment and the production environment, the more risks still preserve related to performance). To test the services unitarily, we could and should use a scaled down infrastructure. In that way, we can test each endpoint close to its boundary without using so many machines for the load simulation. It’s also going to be easier to analyze the results and debug.
In both cases, it is essential to have an exclusive environment since the results will be more or less predictable. They won’t risk be affected by someone else running something at the same time, causing the response times to soar, generating false positives, and wasting a lot of time.
Last but not least, I must admit that I have less experience with the integration tests, so I cannot recommend a frequency for those. Please fill in the blanks by leaving a comment and tell me about your experience!
TAKEAWAY: This model represented by the pyramid is useful for thinking about the different aspects of your testing strategy. There are more aspects to consider when defining a strategy, but try to see if the model helps you to think about them. One example is the next challenge that follows, scenarios and assertions (acceptance criteria).
Challenge #3: Model Scenario and Assertions
This challenge is knowing which type of load tests we want to run everyday and how we define the load and which assertions to add in order to reach our goal: detect a degradation as soon as possible (early feedback).
When we talk about end-to-end tests, in the load simulation, our load scenario and the assertions are based on the business needs (i.e.: how many users will be buying products during the next Black Friday on our servers, and what kind of user experience do we want for them?). There is a great series of articles that explain how to design a performance test in order to achieve this, “User experience, not metrics”, from Scott Barber, from where I learnt most of how I do that today (they’re more than 10 years old, but still relevant).
A different set of questions arises when talking about the bottom layer of the performance testing pyramid: How many threads (or virtual users) do we simulate when we run tests at the API level in a scaled down environment? What is the “expected performance” to validate?
Let’s dig into both considerations.
Detect Performance Degradations When They Happen
As these tests will not be verifying the user experience, we need a different focus. Our strategy is to define a benchmark for a specific version of the system, and then run tests continuously in order to detect a degradation. In a certain way, it’s assuming that the performance that you have today in your infrastructure is okay, and you do not want to miss it when any change negatively affects this current performance.
For that, the tests should have acceptance criteria (assertions) as tight as possible so that for the slightest system regression, before any negative impact occurs, some validation will fail, indicating the problem. This should be done in terms of response times and throughput.
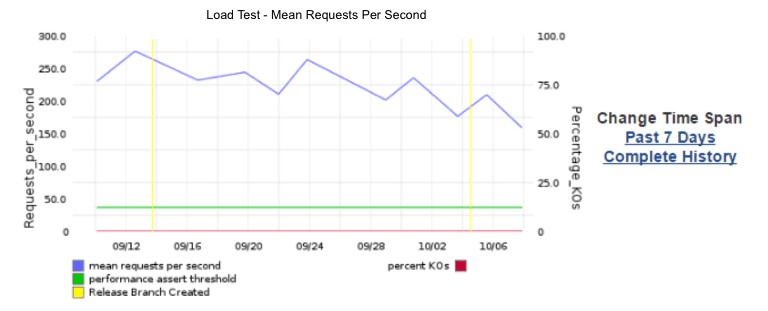
In order to visualize what problem we are solving, see the following graph:
The graph shows a degradation in the requests per second, but the test is passing and it cannot show an alert about this degradation, because the acceptance criteria (the green line) is too flexible. It is verifying that the throughput is greater than 45 req/sec, so when the functionality decreased from 250 to 150 req/sec, no one is likely to be paying attention.
The Load Pushing the System to its Capacity
Here’s a way to define the load and the assertions:
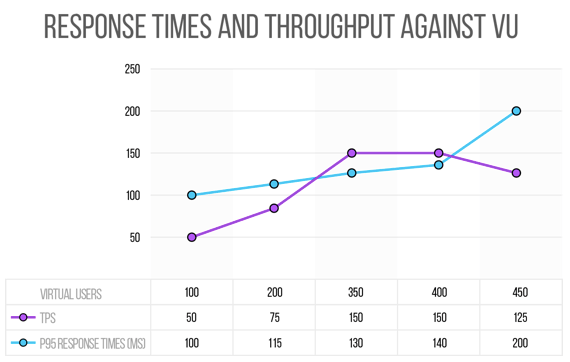
Let’s look at the story of this graph above.
Say we run a first test with 100 virtual users (VU) that results in zero crashes, the response times are below 100ms (at least the 95th percentile) and the throughput is 50 TPS (transactions per second). Then we run the test with 200 virtual users and again, there are no crashes and times are at 115 ms and the throughput at 75 TPS.
Great, it’s scaling.
If we continue on this path of testing, we will at some point, reach a certain load in which we see that we are no longer achieving an increase in the throughput. We will also be getting errors (which exceed 1% for example) which would indicate that we are saturating the server and it’s likely that response times from then on will begin to increase significantly, because some process, connection or something else begins to stick amid all the architecture of the system.
Following this scenario, imagine we get to 350 concurrent users and we have a throughput of 150 TPS, with 130 ms response times and 0% errors. If we pass 400 virtual users and the throughput is still about 150 TPS and with 450 users, the throughput will be even less than 150 TPS.
There is a concept called ”the knee” that we would be encountering with this type of testing illustrated in this graph. We expect the TPS to increase when we increase the number of concurrent users… if it doesn’t happen, it’s because we are overloading the system’s capacity.
So, at the end of this experiment, we arrived at this scenario and these assertions:
- Load: 350 threads
- Assertions
- < 1% error
- P95 Response Times < 130ms + 10%
- Throughput >= 150 TPS – 10%
Then, the test that we will schedule to continue running frequently is that which is executing 350 users, expected to have less than 1% error with expected response times below 130 * 1.1 ms (this way we give ourselves a margin of 10%, maybe 20%), and last but not least, we have to assert the throughput, verifying that we are reaching 150 TPS.
Running these tests after each new change in the code repository, we can detect at the same exact moment when something decreases the performance.
TAKEAWAY: The takeaway here is the model itself, to have it as a reference, but also: think about it. Design a mechanism for defining the load and the assertions that works for you. Do a Retro and adjust the process.
Don’t Over-Engineer your CI
We just looked at the concept of performance testing in continuous integration and the three main challenges of getting started: choosing the right tool, defining the testing strategy, and defining the test scenarios and assertions.
But, of course, that is not all! There are yet more questions to ask, for example:
- Who will create the tests?
- Which test cases do we need? How should we prioritize them?
- Who will maintain them?
- Who will analyze the results?
- What will we do when we find an issue?
- Where and how can we find more information (monitoring, correlate data, logs, etc.)?
And, if there is one more thing I want you to take away from this Agile Testing Days Talk turned blog post, is: Don’t over-engineer your CI!
We as engineers love this, but don’t try to turn this into rocket science. Keep it simple. The tester’s focus is to provide value. And no, we will never reach a perfect product, but we can think of testing’s goal as utopia, or a horizon we are trying to reach… we’ll never get there, but it will keep us moving towards it!
I invite you to try this methodology for adding performance tests to your CI pipeline. Please, contact us if you want to exchange ideas, if you have feedback, questions, or are looking for more help.
You can also access the slideshare from my Agile Testing Days USA talk here.
Recommended for You
How Shutterfly Masters Continuous Performance Testing
Gatling Tool Review for Performance Tests (Written in Scala)
Tags In


Federico Toledo, Chief Quality Officer at Abstracta
Related Posts
System Performance Problems
How do we diagnose and fix system performance problems? While working with systems in production, it is common to encounter system performance problems that must be analyzed and solved. In general, those problems are complex, difficult to replicate issues that occur occasionally and may be…
Unlock Efficient Salesforce Performance Testing Strategies
Learn how Salesforce performance testing enables seamless user interactions and boosts your business impact. Explore Abstracta’s solutions!
Search
Contents
Categories
- Acceptance testing
- Accessibility Testing
- AI
- API Testing
- Development
- DevOps
- Fintech
- Functional Software Testing
- Healthtech
- Mobile Testing
- Observability Testing
- Partners
- Performance Testing
- Press
- Quallity Engineering
- Security Testing
- Software Quality
- Software Testing
- Test Automation
- Testing Strategy
- Testing Tools
- Work Culture


