In this article, I will give you an approach to what was my talk at Selenium Conf 2023, so you can have the step-by-step for creating load tests with JMeter DSL from Selenium scripts as part of your performance testing services. This will help you understand how to verify a website’s accuracy under heavy usage by reusing Selenium tests.
The conference provided a platform for experts in the industry to share their experiences and discuss best practices related to automated testing.
Selenium Conf 2023 valuable learnings are sure to live on and continue to shape the future of test automation.
The insights and knowledge gained during the event are sure to have a lasting impact. To reinforce this purpose and my commitment to it, I will write down everything I shared in the talk so that you can have it at hand in case you need it.
Performance Tests from Selenium Scripts
I would like to share with you a brief yet comprehensive approach to creating performance tests from Selenium scripts. Additionally, I’ll introduce you to an excellent method for generating reports and conducting thorough reviews of both load and user experience metrics. This approach forms an integral part of an optimized performance testing service. Let’s get started!
Frequently, testers need to reuse tests that were implemented with Selenium to verify that a site does not only work as expected with 1 user but with a big load of them. There are many ways that you can do so.
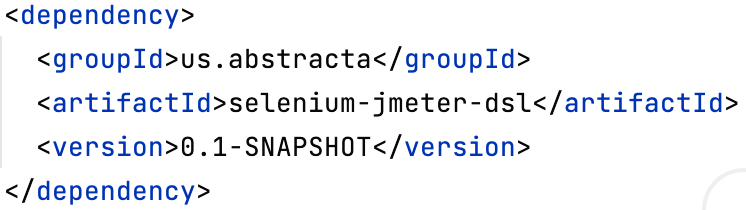
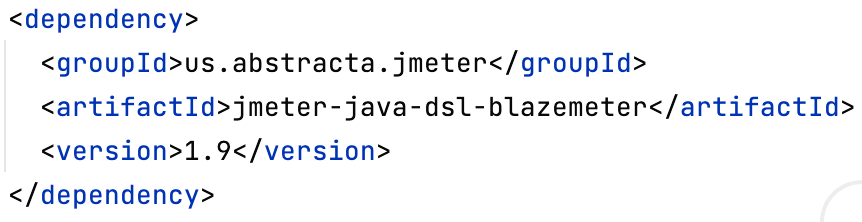
The way I presented requires you to add a maven dependency, and a small initialization code to be added to your existing Selenium test, run it to generate a performance test, and then execute the performance test to evaluate the application behavior.
Here is the source code repository containing the example shown during the presentation. Check the README for more details, but in general, the repository contains an application for testing, a Selenium test for the application, a module to ease the generation of performance tests from Selenium Tests, infrastructure for reporting and dashboards, and instructions on how to generate and run the performance test.
Recording Setup
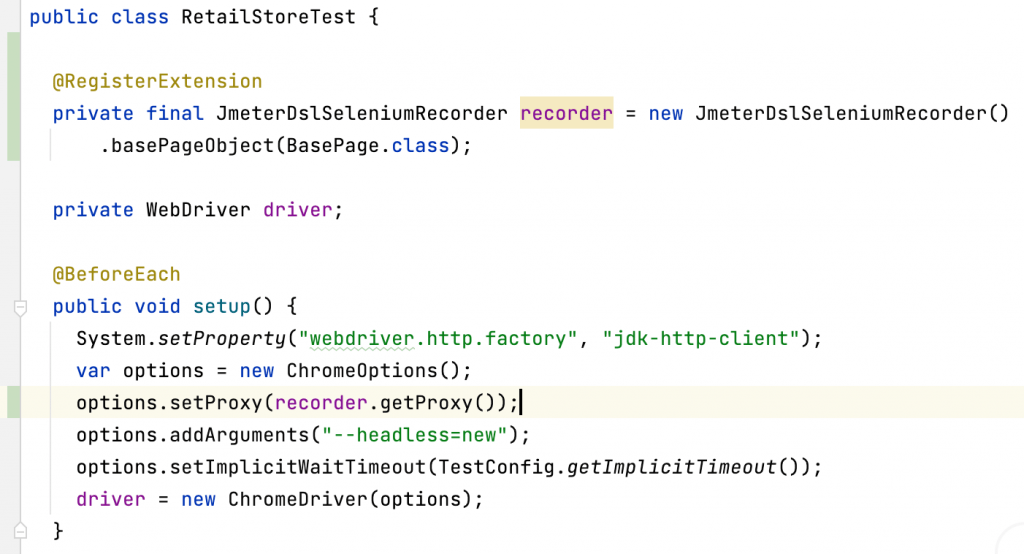
The dependency and initialization code involve the usage of a JUnit extension which automatically starts and stops the JMeter DSL recorder at the beginning of a Selenium test, which is crucial in performance testing services.
As part of this initialization code, you will need to specify the base class for all page objects, which is used to generate a performance test that can measure the time taken on each page while running a generated load test alongside the existing Selenium test, to properly measure the impact to user experience while the load is being imposed on the system.
Additionally, the initialization code includes configuring the recorder as a proxy of the Selenium WebDriver, which allows the recorder to capture every request and response to the backend server, to later generate the load test using JMeter DSL java API.
Performance Test Generation
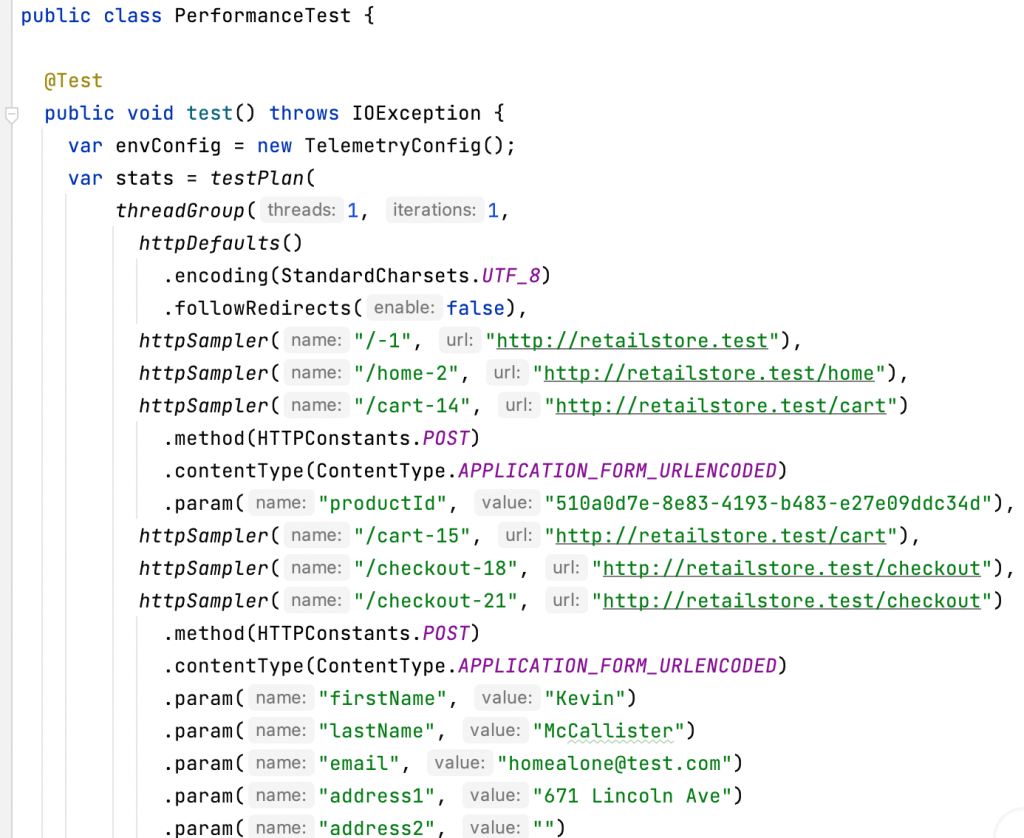
Now you can run your Selenium Test, and a Java class will be generated by the JMeter DSL recorder containing a load test method, and a main method. Here you would usually review the generated load test, check that the recorded backend calls are the expected ones, and if not, tune recorder configuration to suit your needs (e.g.: excluding URLs or headers that are not relevant for your test) to re-record the test.
Performance Test Validation
In general, before generating a load and running the performance test as part of your performance testing services, it is advisable to verify that the test plan or load test runs without any issues and that no longer tuning is required (like requests parameterization, or response/request correlation.)
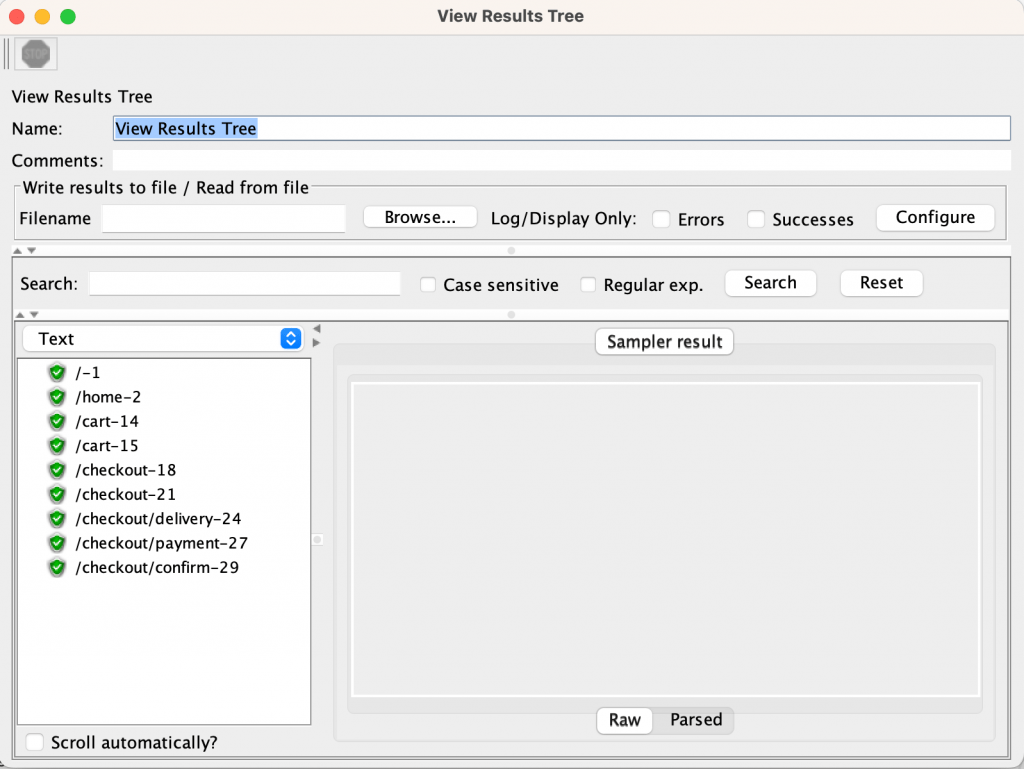
To validate the test plan, you can add a `resultsTreeVisualizer()` and run the load test method keeping thread group configuration to 1 thread and 1 iteration (to only run the test plan once).
Performance Test Tuning
In case you need some parametrization (e.g.: some requests failing due to dynamic data), you might want to define correlation rules, which are not covered in the presentation, but you can get an example of how to define/use them in the repository readme.
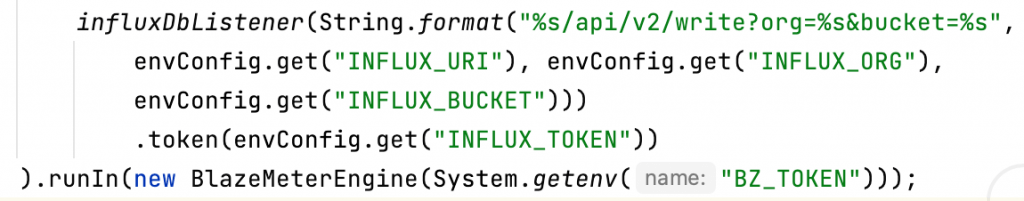
You should also comment out the `influxDbListener` which is not relevant for this validation purposes.
After checking that every request and response worked as expected, you should remove `resultsTreeVisualizer()`.
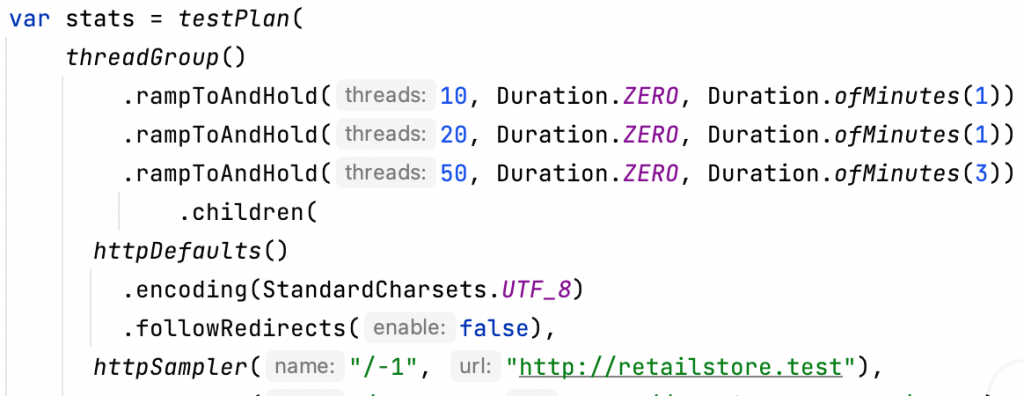
Now, it is time to tune the thread group configuration to generate the actual load on the tested service backend. For that, you can just change the number of threads and iterations or use the `rampToAndHold` method that provides greater flexibility over the load profile to be generated.
Check that the total duration of the load profile matches the Duration value in the main method of the class, so both the backend and the frontend tests run for the same duration of time (by default configured for 5 minutes).
Before executing the test load as part of your performance testing services, you will need to do some further configuration and cleanup. First, add proper configurations (check repository readme) so performance tests can send collected statistics to InfluxDB (for later reporting with Grafana). Uncomment `influxDbListener`, if you have commented it out. And, remove JUnit recorder extension initialization from Selenium Test.
Performance Test Execution
The moment has come to execute the performance test and review how the system behaves. For this, just run the main method in the recorder-generated class. This will trigger the backend load test, while at the same time running the Selenium test in a loop for the configured duration.
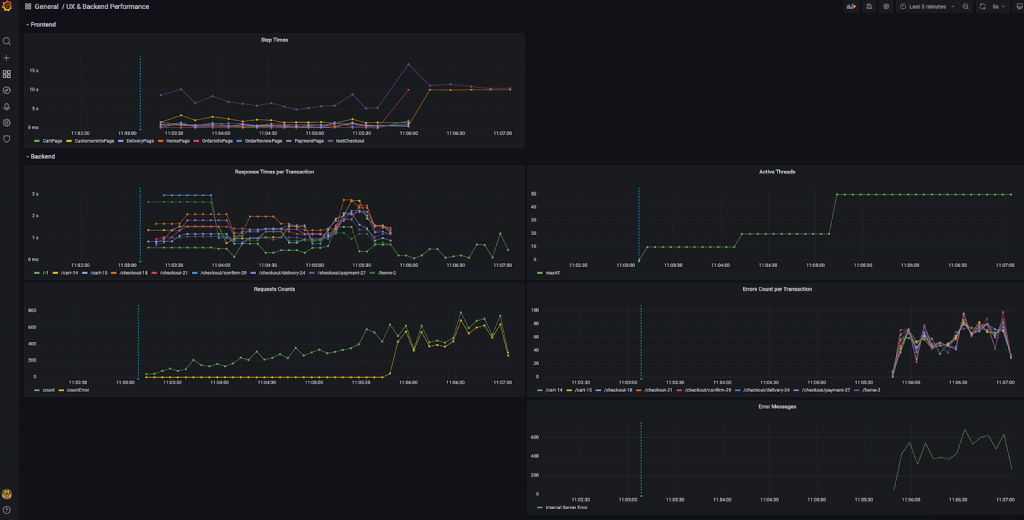
While the test is running you can check in your Grafana dashboard (which should have been previously configured, alongside InfluxDB, you can check more details in the provided repository `docker-compose.yml` file) how the system is behaving, and how load in the backend is affecting the time spent by Selenium test in each page.
Scaling Performance Test
In general, generating load with just one machine could prove to be insufficient, and you may need to use a cluster of machines to generate enough load to verify the proper behavior of your system under significant load.
For this, you can use one of JMeter DSL-provided engines, like BlazeMeter, Octoperf, or DistributedJMeter engines, and run your load test from a cluster of machines quite easily.
Some Considerations for the Presented Approach to Performance Testing Services
✅The provided project is an example of how you can achieve this using JUnit 5, Java 19, Selenium 4.8, Chrome 111, and measuring time in Selenium pages by checking Page Object creation times.
In your particular case, you can use the example to create a similar integration for the particular versions or technologies you use. Consider that JMeter DSL is independent of the testing framework (JUnit, TestNG), is compatible with Java 8+, and has no direct relation to Selenium itself.
✅Even though InfluxDB and Grafana are being used in this scenario, you may use other technologies for reporting, like Elasticsearch, Prometheus, Kibana, etc.
Changes, and the discord channel, and be part of the community. Help us make JMeter DSL easier to use and better for everyone!