Motivation:
- OpenJDK 19, to be released in September 2022, will incorporate a new disruptive solution: Virtual Threads, aka Project Loom.
- We want to learn if it is beneficial to use Virtual Threads in an application like JMeter to improve its performance.
- We want to experiment with JMeter DSL as a prototyping platform for JMeter customization.
To explore the motivation above, this article covers a general introduction of the current state of JMeter and other alternatives, a high-level overview of project Loom, how to use JMeter DSL to implement a custom thread group that uses Virtual Threads, and the results and conclusions of our experiments and some ideas for the future.

JMeter & Java Loom
Intro
Since our first release of jmeter-java-dsl we have always had in mind to combine all the benefits of JMeter with the ones provided by other existing performance testing tools like Gatling, Taurus, k6, etc. Filling a gap that we thought, and have proven after interacting with the community, would be beneficial for anybody who wants to do performance testing.
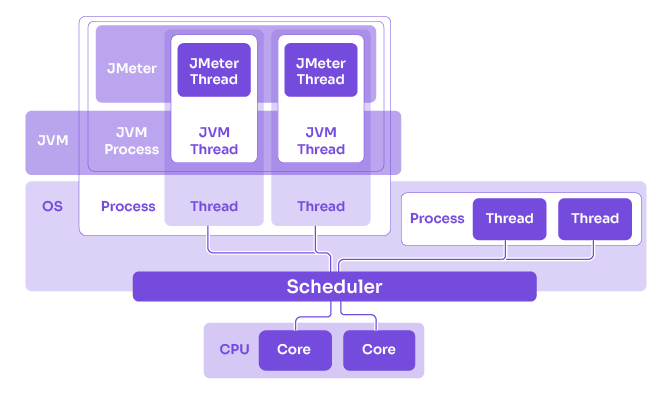
One of the points that differentiates JMeter from other tools is its concurrency model (how it executes requests in parallel).
JMeter uses Thread Pools, which are the standard way in Java (and several other languages) to do parallel processing. But this concurrency model has a significant drawback: it is resource expensive. For every JMeter thread, a Java thread is created and for each Java thread, an OS (Operating System) thread is used. OS threads are relatively heavyweight, compared to some alternatives, both in memory and in CPU (while doing context switching). Additionally, some OSes impose limits on the number of threads that can be created, effectively limiting JMeter.
Some options to overcome this “inefficiency” and limitation imply the usage of some alternative library or even a different language, to use some other mechanisms like reactive programming (like RxJava), actor model (like the one implemented by Akka and used by Gatling through Scala), kotlin coroutines, etc.
In most cases, when running a performance test, the different approaches don’t have much difference in test generation performance, since in most of them the memory and CPU are taken by other aspects of the performance testing tool (eg: variables, response extraction and body generation in correlation, serialization & deserialization of requests and responses, etc) and the slow part in execution is generally in networking or server processing. Here is a performance comparison between JMeter and Gatling.
But, there is even another option, that doesn’t require a separate library or changing language: enter OpenJDK project Loom.
Project Loom: Virtual Threads
We will not get into much detail about project Loom, you can learn more about it here, or here. But, in essence, it allows you to use some lightweight threads (aka virtual threads) that are dynamically assigned to standard Java (aka platform threads) & OS threads (multiple virtual threads per platform thread).
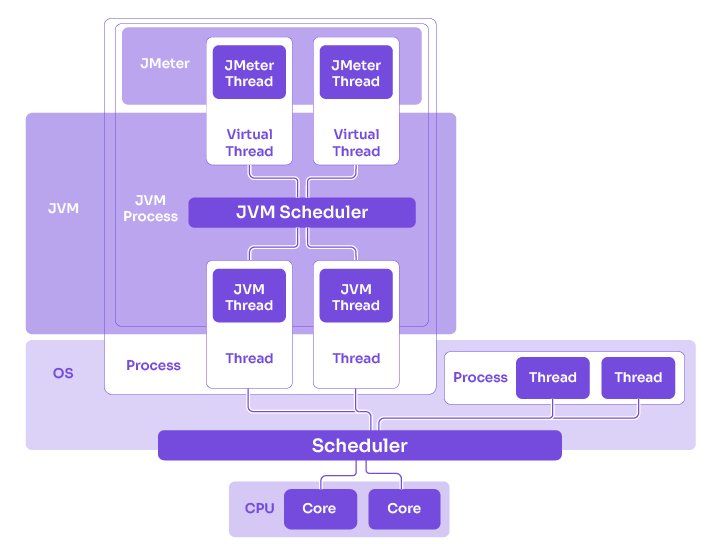
This does not only reduce resource consumption allowing to generate more load from the same hardware but also keeps all the benefits of the existing Java Thread model (traceability, knowledge, support, etc).
For instance, in an existing Java application using platform threads, you can easily switch to using virtual threads by replacing new Thread invocations with something like Thread.ofVirtual(). No need to change IO (Input/Output) operations, locks, or sleeps, OpenJDK team has already taken care of all such methods. Internally, a virtual thread assigned/mounted to a platform thread is suspended/unmounted when such operations are invoked and then re-assigned when the operation ends. Additionally, exceptions, stack traces, debugging tools, and other existing tools work out of the box, no need to worry about callbacks, chains of flow calls and observers, use some specific IO or concurrency library/API, etc.
There are very interesting articles about the usage of project Loom in different scenarios like this experiment using virtual threads with Apache Tomcat.
After our first release of JMeter DSL, we did some trials with project Loom and JMeter thread groups, but, at the time, the technology was a little immature and there were some rough edges still to polish: we were experiencing some random issues in our tests, some inconsistent behavior, but the initial results seemed to be promising. Additionally, it was not clear when such technology would be generally available in the JVM.
The JMeter team has also discussed some alternatives in the past as well. For instance, they have explored using Kotlin coroutines. You can check some discussions here.
This has significantly changed since OpenJDK team has announced the inclusion of the first preview of project Loom in its upcoming JDK 19 (whose release is expected for September).
With this in mind, we have decided to give it another try and publish the results.
JMeter + Loom experiment
To review if project Loom could easily be used in JMeter and what the differences with the existing model would be, we have decided to go with the simplest approach at our hand: implementing with JMeter DSL a new thread group that just uses virtual threads instead of platform threads, porting and adapting part of JMeter default thread group logic.
Using JMeter DSL allows us to focus on parts of logic that actually change, and quickly iterate over implementation, instead of having to worry about JMeter plugins or JMeter modification details like GUI elements, compiling, packaging, etc.
Before doing that, we have to install the latest version of early access JDK 19. This can be easily done with sdkman, like this:
sdk install java 19.ea.23-openNote: latest available early access of jdks vary frequently, so you might need to change the version if you try to do the same.
We then create a new Maven project that implements the new thread group using JMeter DSL as the main framework for JMeter extension and usage. Here is the code for the project.
Reviewing the code you can see that it is pretty simple to create a new thread group by extending BaseThreadGroup DSL class which returns in buildThreadGroup method a custom subclass of AbstractThreadGroup JMeter class. In this case, we just copied the logic from the ThreadGroup JMeter class that we want to customize. In particular, the startNewThread method, which is the one in charge of creating the threads where we changed this line:
Thread newThread = new Thread(jmThread, jmThread.getThreadName());With this:
Thread newThread = Thread.ofVirtual()
          .name(jmThread.getThreadName())
          .unstarted(jmThread);
Additionally, we also changed addNewThread method by replacing synchronized occurrence with a ReentrantLock usage, since, in the current JDK implementation, project Loom locks OS threads when finding a synchronized block instead of just suspending virtual threads.
We haven’t changed every occurrence of synchronized blocks in JMeter (for example in ResultCollectors) to simplify implementation because such changes would not have a significant impact since the blocks don’t include slow or heavy logic. Additionally, we haven’t detected any thread pinning while using -Djdk.tracePinnedThreads (used to detect virtual threads blocked in monitors).
To simplify tests and avoid further complexities, the implemented thread group has no support for delays or ramp up. The tests will use Java client implementation for HTTP sampler to avoid having to also port part of httpClient thread pool handling.
To compile and run the tests, since virtual threads is a preview feature, we need to specify the --enable-preview JVM flag.
Since we get different results with top (which in general reports higher CPU and RAM) than with VisualVM & Java Flight Recorder, we opt to monitor resources with top which gets the OS perspective on the process, avoiding anything that might be missing in JVM tools that may not have yet fully covered early access features.
The main focus of the tests is checking if there is any difference in TPS, RAM consumption, CPU, or general results between platform threads and virtual threads. We are not going to experiment much with JVM settings, try to tune code, or check actual limitations of the load generator or service under test to keep the tests simple and reduced scope.
Every test uses a thread group duration of 5 mins and each configuration is executed 3 times to ignore any potential outlier.
Now we only have to run some tests with default and new thread groups with different loads and check the results :).
Results
Let’s now run some tests experimenting with different loads and deployment scenarios and see what differences we see between virtual and platform threads.
Local tests
First, we try running some tests from a local machine (MacOS 11.5, Intel Core i7, 6 cores at 2.5 GHz, and 16GB of RAM) against a remote site at http://opencart.abstracta.us, which is an Abstracta hosted version of OpenCart.

We start with this type of test, from local to remote service, since it is good in some scenarios to collect end-user metrics and is a common scenario when starting with performance testing.
We will not run any further tests locally since we can’t further compare with platform threads. The system under test is failing a lot and we have already identified a significant difference between platform and virtual threads.
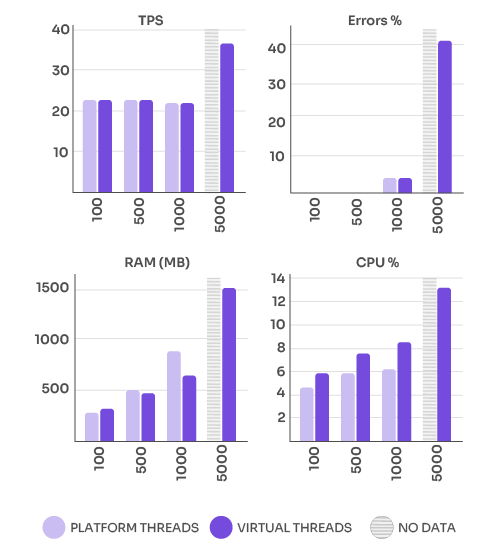
Here is a chart for quick visualization:
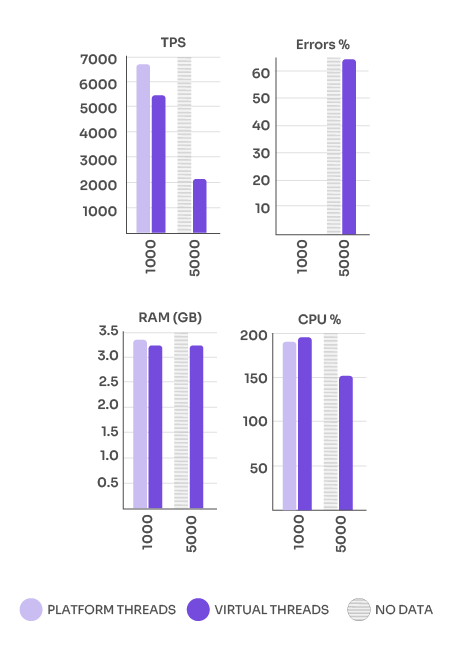
Server to Server test
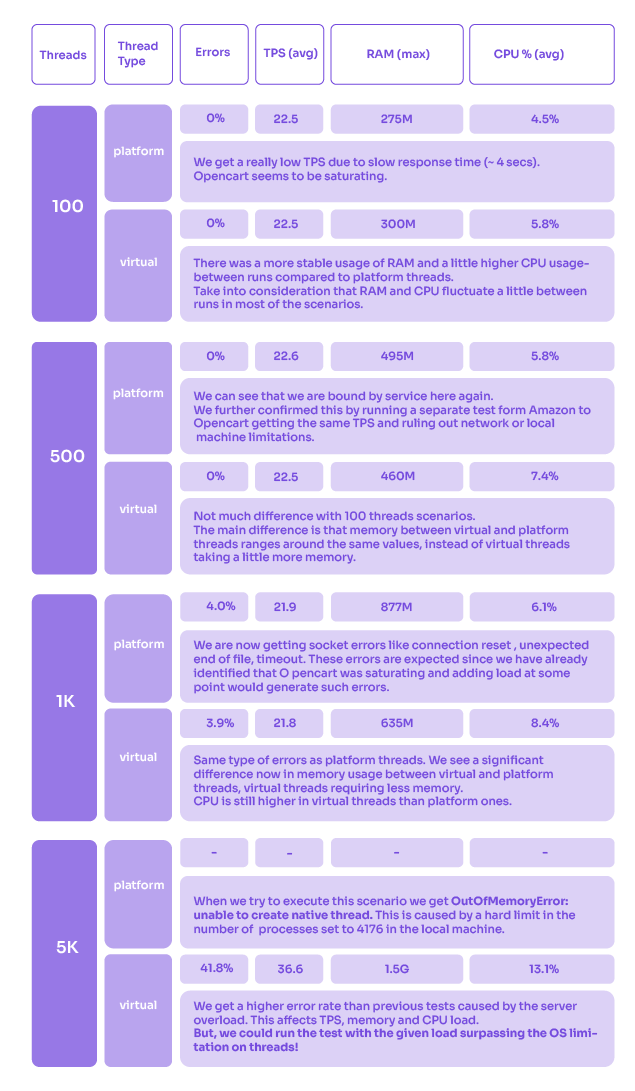
Since running tests from a local machine to a remote server may include fluctuations caused by network or local machine issues (other apps intervening, OS limitations, etc), we are now going to test with two servers in the same network. Additionally, since Opencart was quite slow and easily saturated, let’s try this time with nginx default index site which should get us a really fast response time.

For these executions, we will use two t2.medium (2 vCPUs, 4GB RAM) Amazon EC2 instances in the same availability zone running Amazon Linux. To manage the infrastructure we use a pulumi project that you can find in the code repository here. One of the instances will run the JMeter test script, and the other one will just run nginx using a Docker container (which eases setup).
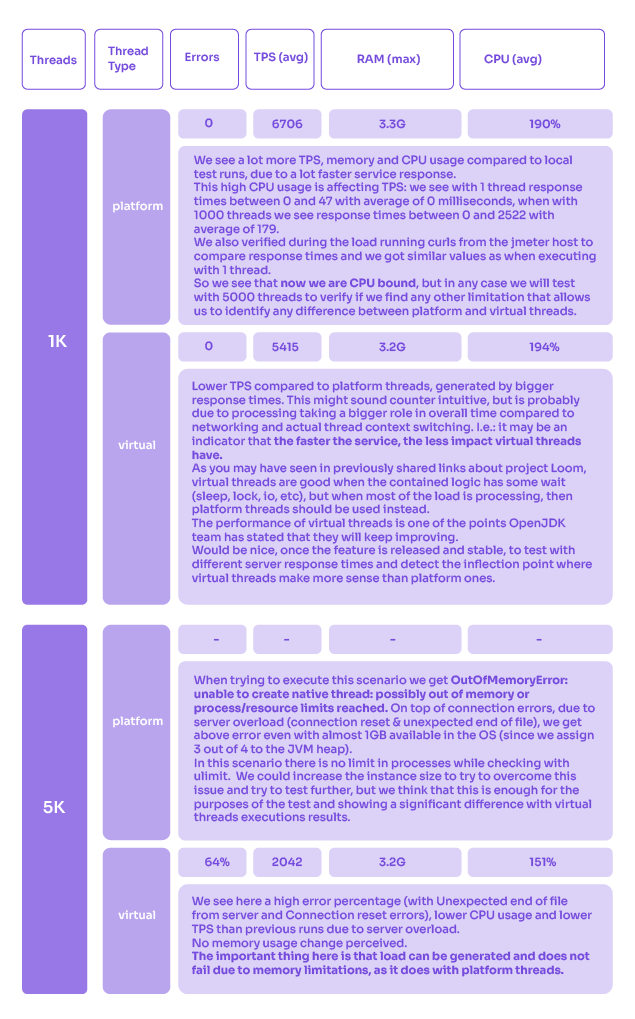
We don’t run any further tests since the service under load is already overloaded and we have already identified a difference between virtual and platform threads.
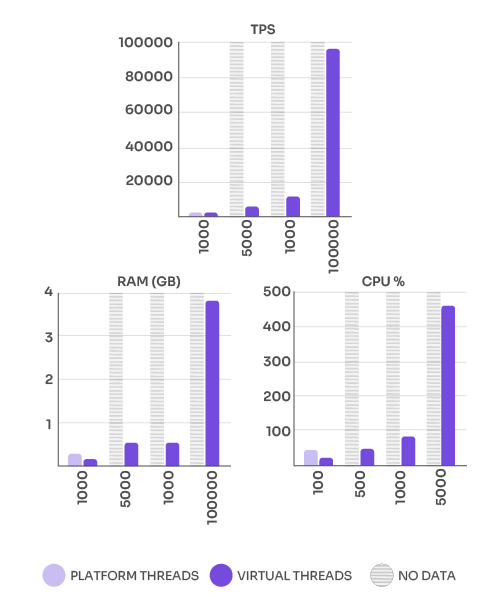
Dummy test
Finally, let’s just run some local tests with a dummy sampler with 1 second response time emulation to see, just out of curiosity, how much we can get without having the network connection in the middle and how does performance evolve above 5K virtual threads.

As the number of threads increases, we see an expected increment in deviation from ideal TPS due to the higher load imposed on the machine.
Conclusions and Next Steps
The first conclusion we can draw from this experiment is that it is quite simple to implement new JMeter elements and try out ideas with JMeter DSL. It sounds like a good solution to prototype ideas, and later on contribute them to actual JMeter code or implement a new JMeter plugin.
Regarding results, in general, there is not much difference in CPU or RAM usage in usual scenarios between virtual and platform threads. Even though virtual threads might be “lighter” than platform ones, it is nothing compared to the resources required by JMeter Thread Variables, JMeter Thread test plan trees (JMeter clones one tree per thread), Sample Results, etc. We have seen a lower TPS and higher CPU usage in virtual threads when hitting really fast services, but that might be a “temporal” difference since virtual threads have a margin of improvement per OpenJDK team words. A difference does appear when using a dummy sampler, but that is a pretty fictional scenario.
There is not much difference either in speed since most of it is spent on operations that are a lot more expensive than thread context switching: networking, serialization, deserialization, etc.
The main difference can be seen when trying to generate more concurrency than the process limit imposed by the OS. With virtual threads, the process limit does not interfere.
Something that you have to take into consideration when using virtual threads is that they are optimal for tasks that require some wait (IO, lock, sleep), so the more processing you have in the thread, the less sense the transition to virtual thread makes in terms of performance. You may use them to better organize parallel work or to bypass OS level limitations on threads, but don’t look into them as a way of improving the performance of a computing intensive process.
It would be interesting in the future to review and experiment with httpClient implementation with virtual threads and run some tests with connection reuse. This would help cover more cases of actual performance tests which usually have such needs. Additionally, this would probably make better usage of virtual threads, since less processing would be taken on connection and disconnection associated logic (creation of objects to support them) and more waits on IO.
As for the Loom project and its future, we think that virtual threads bring a new solution to the JVM which avoids the problems when using platform threads and also the problems with existing alternatives. We are very eager to see how this new technology evolves, improves, and is incorporated into different tools.
In particular, we hope for JMeter to integrate this soon after its release since it provides a very helpful option when we are struggling with OS limitations.
We encourage you to keep an eye on it, try it, try the JMeter DSL if you haven’t already, and give it a star here.
What do you think? Were the results the ones that you would expect? Were you aware of the Loom Project? Please share your thoughts & comments, we really appreciate the exchange.
Follow us on Linkedin, Twitter, and Facebook to be part of our community!

How Soon is Too Soon to Carry Out Performance Tests?
Many developers do not know when to carry out performance tests for optimum results. It’s very common of them to leave performance testing for the end as an afterthought if they have enough time. In other cases, they ask around in their spare time to…

Top Performance Testing Tools to Prepare Your Website for Black Friday
The e-commerce industry’s busiest day is just around the corner… Are you ready? Everyone knows that Black Friday and Cyber Monday are the most popular online shopping days of the year (besides Amazon’s Prime Day), but it’s also a day that is notorious for website…


