1. Average response time. 2. Standard deviation. 3. Percentiles 90, 95, and 99. Discover key and advanced performance testing metrics to improve results with Abstracta.

Unlocking the full potential of performance testing means delving into the performance metrics that matter. It’s not enough to run tests and gather data; the real power lies in accurate analysis and deep understanding, empowering you to make informed decisions and boost your system’s performance.
The issue is that if you don’t understand well what each one means or what they represent, you’ll come to some very wrong conclusions, potentially leading to performance degradation instead of achieving consistent performance.
So whether you are testing for concurrent users simultaneously accessing the system or measuring key performance indicators, having the right approach to core performance testing metric is crucial. These measures system performance and help align with user expectations.
However, it is also important to consider additional performance testing metrics, including backend, frontend, and system behavior metrics, which can help uncover hidden patterns or secondary factors impacting the system.
In this post, we focus on average response time, standard deviation, and percentiles, while also exploring the role of these additional metrics in providing a more comprehensive understanding of system performance.
Boost your system’s performance today! Book your meeting with our experts!
The Importance of Analyzing Data as a Graph
The first time we thought about this subject was during a course that Scott Barber gave in 2008 (when we were just starting up Abstracta), on his visit to Uruguay. He showed us a table with values like this:
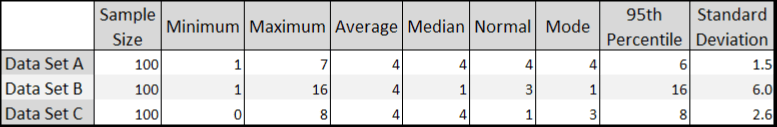
He asked us which data set we thought had the best performance, which is not quite as easy to discern as when you display the data in a graph:
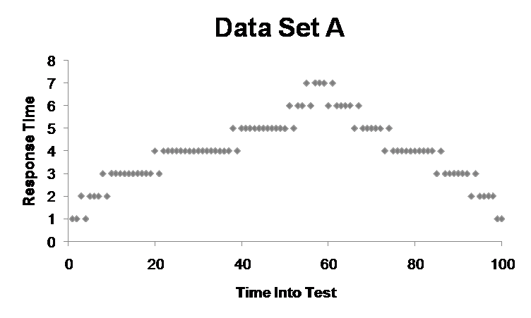
In Set A, you can tell there was a peak, but then it recovers.
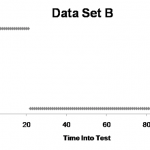
In Set B, it seems that it started out with a very poor response time, and probably 20 seconds into testing, the system collapsed and began to respond to an error page, which then got resolved in a second.
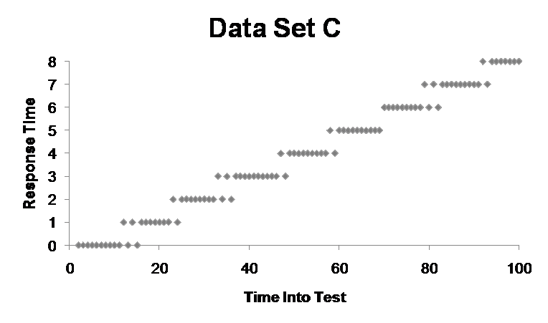
Finally, in Set C, it’s clear that as time passed, the system performance continued to degrade.
Barber’s aim with this exercise was to show that it’s much easier to analyze information when it’s presented in a graph. In addition, in the table, the information is summarized, but in the graphs, you can see all the points. Thus, with more data points, we can gain a clearer picture of what is going on.
Interested in data analysis? Keep learning here: Data Observability: What It Is and Why It Matters.
Understanding Key Performance Testing Metrics

Okay, now let’s see what each of the metrics for performance testing means, as a key part of your performance testing process. Evaluating key performance indicators helps confirm that your tests align with business objectives.
Average Response Time
To calculate the average, simply add up all the values of the samples and then divide that number by the quantity of samples.
Let’s say we do this and our resulting average peak response time is 3 seconds. The problem with this is that, at face value, it gives you a false sense that all response times are about three seconds, some a little more and some a little less, but that might not be the case.
Imagine we had three samples, the first two with a response time of one second, the third with a response time of seven:
1 + 1 + 7 = 9
9/3 = 3
This is a very simple example that shows that three very different values could result in an average of three, yet the individual values may not be anywhere close to 3.
Fabian Baptista, co-founder and member of Abstracta’s board, made a funny comment related to this:
“If I were to put one hand in a bucket of water at -100 degrees Fahrenheit and another hand in a bucket of burning lava, on average, my hand temperature would be fine, but I’d lose both of my hands.”
So, when analyzing average response time, it’s possible to have a result that’s within the acceptable level, but be careful with the conclusions you reach.
That’s why it is not recommended to define service level agreements (SLAs) using averages; instead, have something like “The service must respond in less than 1 second for 99% of cases.” We’ll see more about this later with the percentile metric.
Don’t miss this Quality Sense Podcast episode about why observability is such relevant in software testing, with Federico Toledo and Lisa Crispin.
Standard Deviation
Standard deviation is a measure of dispersion concerning the average, how much the values vary for their average, or how far apart they are.
If the value of the standard deviation is small, this indicates that all the values of the samples are close to the average, but if it’s large, then they are far apart and have a greater range.
To understand how to interpret this value, let’s look at a couple of examples.
If all the values are equal, then the standard deviation is 0. If there are very scattered values, for example, consider 9 samples with values from 1 to 9 (1, 2, 3, 4, 5, 6, 7, 8, 9), the standard deviation is ~ 2.6 (you can use this online calculator to calculate it).
Although the value of the average as a metric can be greatly improved by also including the standard deviation, what’s more useful yet are the percentile values.
Percentiles: p90, p95, and p99

Understanding percentiles is crucial for accurate system performance analysis. These metrics are particularly useful when testing with virtual users during test execution, as they help simulate real-world scenarios where multiple users interact with the system simultaneously.
Additionally, percentiles provide insights into how the system performs under varying loads, enabling teams to identify bottlenecks and optimize resource allocation.
Let’s break down what percentiles like the 90th percentile (p90), p95, and p99 mean and how they can be used effectively in performance tests.
What Are Percentiles?
A percentile is a valuable performance testing metric that gives a measure under which a percentage of the sample is found. This helps in understanding the distribution of response times and other performance metrics. The percentile rank is another important metric that helps in understanding the distribution of response times.
The 90th Percentile (p90)
The 90th percentile (p90) indicates that 90% of the sample values are below this threshold, while the remaining 10% are above it. This is useful for identifying the majority of user experiences and boosting that most users have acceptable response times.
The 95th Percentile (p95)
The 95th percentile (p95) shows that 95% of the sample values fall below this threshold, with the remaining 5% above it. This provides a more stringent measure of performance, enabling nearly all users to have a good experience.
The 99th Percentile (p99)
The 99th percentile (p99) represents the value below which 99% of the sample falls, leaving only 1% above it. This is particularly useful for identifying outliers and making it possible that even the worst-case scenarios are within acceptable limits.
Why Use Multiple Percentiles?
Analyzing multiple percentile values, such as p90, p95, and p99, provides a more detailed view of system performance. Tools like JMeter and Gatling include these in their reports, allowing teams to calculate percentile scores using different methods. This comprehensive approach helps in identifying performance bottlenecks and understanding how the system behaves under various conditions.
Complementing Percentiles with Other Metrics
To get a complete picture, teams should complement percentiles with other metrics like minimum, maximum, and average values. For example:
- p100: Represents the maximum value (100% of the data is below this value).
- p50: Known as the median (50% of the data is below and 50% is above).
Establishing Acceptance Criteria
Teams often use percentiles to establish acceptance criteria. For instance, setting a requirement that 90% of the sample should be below a certain value helps in ruling out outliers and enabling consistent system performance. This is particularly useful in identifying issues related to memory utilization and other critical performance aspects.
By focusing on the percentile score, teams can make more informed decisions and optimize their performance tests to achieve better results.
Need Help with Percentiles? Explore our Performance Testing Services!
Beyond the Core Metrics: Backend, Frontend, and System Behavior Insights
While average response time, standard deviation, and percentiles are the cornerstone metrics for understanding overall system performance, they provide a high-level view that doesn’t always reveal the root causes of performance issues.
To dig deeper, it’s important to analyze additional metrics that focus on the backend, frontend, and overall system behavior. For long-term reliability, incorporating endurance testing helps evaluate how the system performs under sustained load conditions. Let’s explore these key metrics.
What Are Backend Metrics?
Backend metrics focus on the performance of the server-side infrastructure, which is responsible for processing requests, managing resources, and validating whether the system responds efficiently under load.
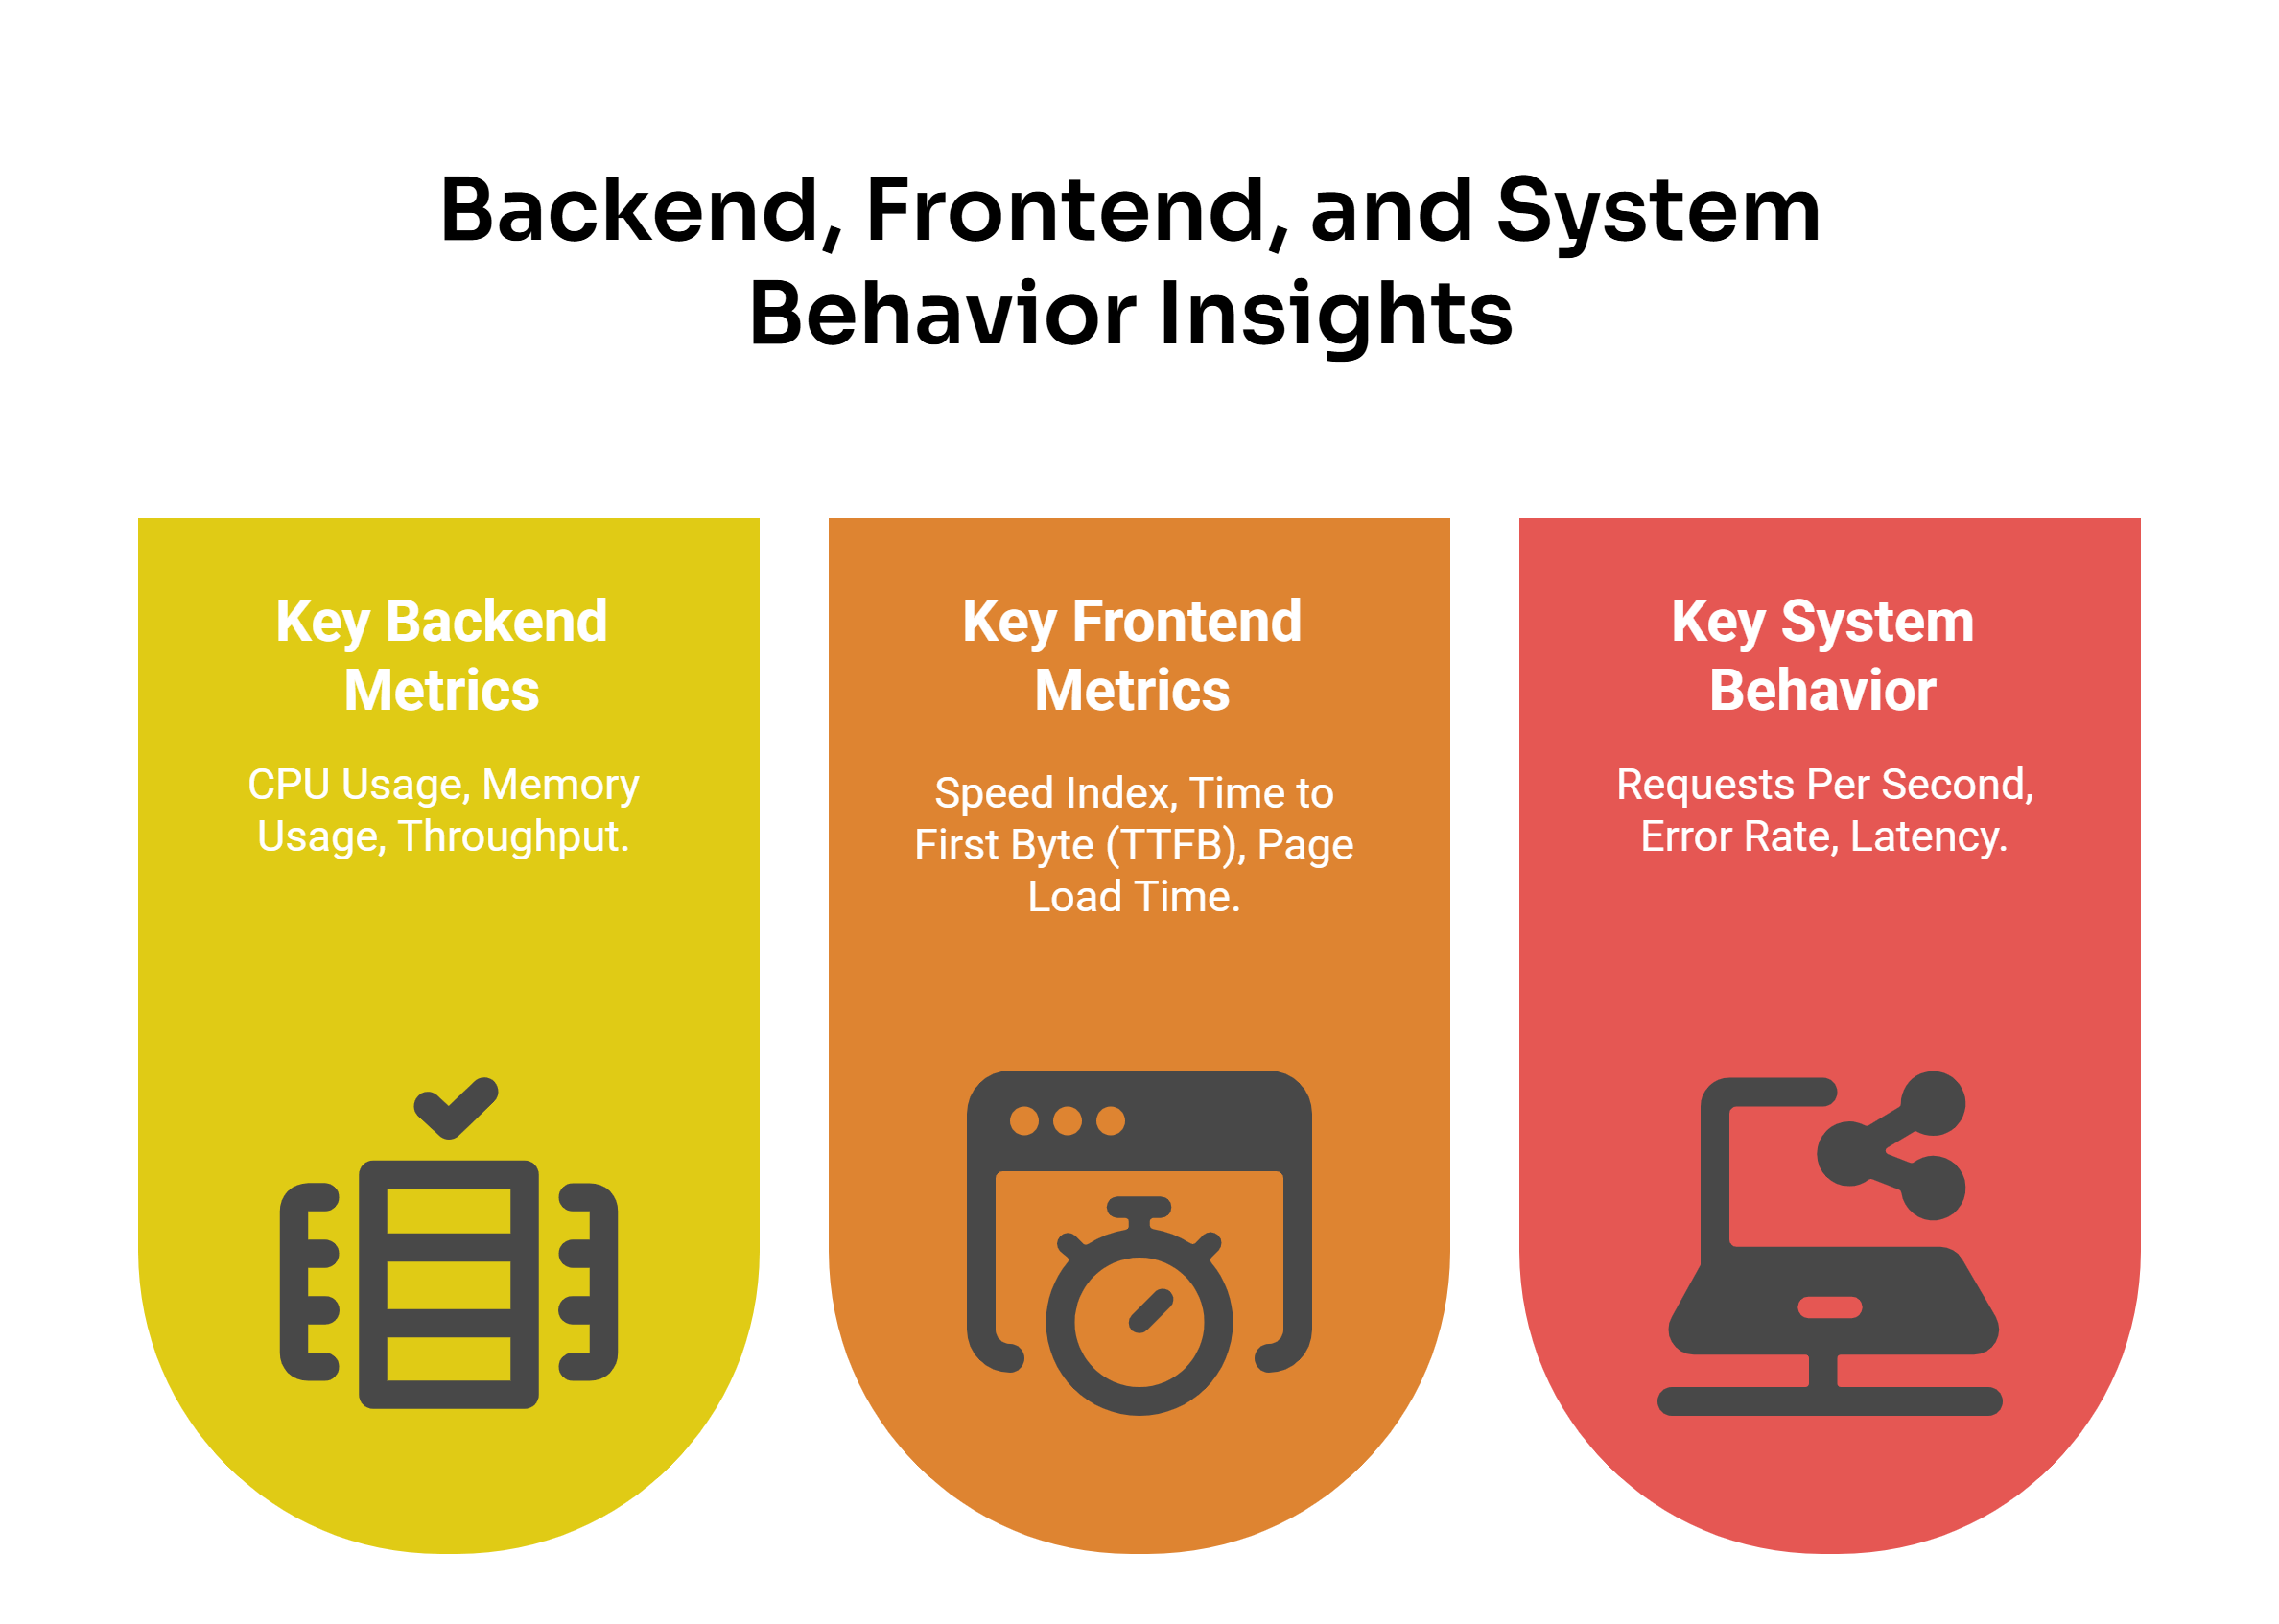
Key Backend Metrics
- CPU Usage: Tracks how much processing power is being used by the server. High CPU usage during peak loads can indicate bottlenecks that need to be addressed.
- Memory Usage: Monitors how much memory the server is consuming, helping to identify inefficiencies or potential overloads.
- Throughput: Measures the number of requests the server can handle over a specific period, helping to validate whether the system can scale to meet increasing user demands.
Backend metrics like CPU utilization and memory usage, which fall under the broader concept of resource utilization, provide insights into how efficiently the server is using its resources.
Tracking issues such as slow response times can reveal delays caused by database queries, API calls, or other backend processes. Similarly, monitoring failed requests is essential for identifying critical errors that could disrupt the system’s ability to process user actions effectively.
What Are Frontend Metrics?
Frontend metrics focus on the user-facing side of the system, evaluating how quickly and efficiently the interface loads and responds to user interactions. These metrics are essential for improving website performance and creating a seamless user experience.
Key Frontend Metrics
- Speed Index: Assesses how quickly the visible parts of a web page are rendered, providing a clear indicator of perceived performance.
- Time to First Byte (TTFB): Evaluates the time it takes for the browser to receive the first byte of data from the server, which can highlight delays in server response.
- Page Load Time: Monitors the total time it takes for a page to fully load, including all assets like images, scripts, and stylesheets.
Analyzing the loading process helps identify delays that could significantly impact the user experience and have a direct effect on customer satisfaction. For example, making sure a web page can load completely without interruptions is critical for maintaining a smooth user experience. By focusing on client side performance testing metric, teams can identify issues like slow rendering or excessive JavaScript execution that may degrade the user experience.
What Are System Behavior Metrics?
System behavior metrics analyze how the entire system reacts under different conditions, such as high traffic or prolonged usage. They provide a holistic view of performance and help identify patterns that could lead to potential issues.
Key System Behavior Metrics
- Requests Per Second: Quantifies the number of requests the system can handle, helping to evaluate its capacity under varying loads.
- Error Rate: Tracks the percentage of failed requests, which is critical for identifying issues that could disrupt the system’s functionality.
- Latency: Calculates the time it takes for a request to travel from the client to the server and back, providing insights into potential delays in the system.
Analyzing user traffic patterns helps teams understand how different load levels impact the system, enabling better capacity planning and resource allocation. Identifying issues like memory leaks is also crucial for maintaining long-term stability, as these can lead to degrading performance over time.
Overall, by combining backend, frontend, and system behavior metrics with core metrics like average response time, standard deviation, and percentiles, you can gain a deeper understanding of your system’s performance. As you analyze them, it’s important to keep in mind certain considerations to avoid common pitfalls and misinterpretations. Let’s explore these in the next section.
Don’t Let Downtime Cost You – Contact us and Enhance Your Performance Journey!
Careful with Performance Testing Metrics

Before you conduct performance testing or analyze your next software performance testing results, make sure to remember these key considerations:
1. Avoid Averages
Never consider the average as “the” value to pay attention to, since it can be deceiving, as it often hides important information.
2. Check Standard Deviation
Consider the standard deviation to know just how useful the average is, the higher the standard deviation, the less meaningful it is.
3. Use Percentile Values
Observe the percentile values and define acceptance criteria based on that, keeping in mind that if you select the 90th percentile, you’re basically saying, “It’s acceptable that 10% of my users experience bad response times”.
If you are interested in learning about the best continuous performance testing practices for improving your system’s performance, we invite you to read this article.
4. Overall System Health
Understanding metrics like server CPU capacity utilized and memory usage in certain cases can provide insights into how efficiently the system is processing requests.
What other considerations and performance issues do you have when analyzing performance testing metrics? Let us know!
Looking for a Free Performance Load-testing Tool? Get to Know JMeter DSL, one of the leading open-source performance testing tools for Java and .NET developers.
FAQs About Performance Testing Metrics

What Are Performance Metrics in Performance Testing?
Performance metrics in performance testing are metric measures used to assess how a system performs under different conditions. They help identify bottlenecks, optimize resource usage, and provide valuable insights for the development team to improve overall system reliability.
What Are the Three Types of Performance Metrics?
These three metrics work together to analyze performance trends, detect bottlenecks, and improve system efficiency.
- Average Response Time – Measures how long, on average, the system takes to respond to requests.
- Standard Deviation – Indicates how much response times fluctuate from the average, revealing performance variability.
- Percentiles (p90, p95, p99) – Show the response time thresholds for most users, helping identify outliers and ensure a good user experience.
Note: While these are common metrics often asked about, we also recommend exploring other metrics discussed in this article, such as backend, frontend, and system behavior metrics, for a more comprehensive analysis.
What Are KPIs in Performance Testing?
They are specific metrics used to evaluate how well a system meets its performance goals. Common KPIs include response time, throughput, error rate, and resource utilization. These indicators help teams measure progress, identify bottlenecks, and validate whether the system aligns with business objectives.
What Is P99 in Performance Testing?
It represents the value below which 99% of the sample data falls. It’s particularly useful for identifying outliers and understanding worst-case scenarios, checking that even the most demanding user experiences are within acceptable limits.
How to Measure Performance Metrics in Software Testing?
To measure performance metrics in software testing, use performance testing tools to simulate real-world scenarios. Collect data on the metrics detailed in this article, including minimum response time, maximum response time, and user load, and analyze the results to identify bottlenecks and optimize system performance.
How We Can Help You

With over 16 years of experience and a global presence, Abstracta is a leading technology solutions company with offices in the United States, Chile, Colombia, and Uruguay. We specialize in software development, AI-driven innovations & copilots, and end-to-end software testing services.
We believe that actively bonding ties propels us further. That’s why we’ve forged robust partnerships with industry leaders like Microsoft, Datadog, Tricentis, Perforce, and Saucelabs, empowering us to incorporate cutting-edge technologies.
By helping organizations like BBVA, Santander, Bantotal, Shutterfly, EsSalud, Heartflow, GeneXus, CA Technologies, and Singularity University we have created an agile partnership model for seamlessly insourcing, outsourcing, or augmenting pre-existing teams.
Visit our Performance Testing Services page! Contact us to improve your system’s performance.

Follow us on Linkedin & X to be part of our community!
Recommended for You
API Performance Testing: Optimize Your User Experience


How to Measure Mobile App Performance?
In the digital age, where mobile apps drive most user engagement, enhancing optimum performance is not just crucial—it’s expected. Dive into our guide on mastering the art of mobile app performance testing and staying ahead of the curve. In today’s tech-driven world, a mobile app’s…

Quality Sense Podcast: Leandro Melendez “Señor Performo” – Performance Testing Explained Simple
What do restaurants and performance testing have in common? We’ll spoil the punchline…. It’s servers that get stressed! In this episode of our software testing podcast, Federico interviews Leandro Melendez, whom he refers to as a “Latin American brother” also known as “Señor Performo.” Originally…


